
Turn on suggestions
Auto-suggest helps you quickly narrow down your search results by suggesting possible matches as you type.
Showing results for
Turn on suggestions
Auto-suggest helps you quickly narrow down your search results by suggesting possible matches as you type.
Showing results for
Community Tip - Want the oppurtunity to discuss enhancements to PTC products? Join a working group! X
Options
- Subscribe to RSS Feed
- Mark Topic as New
- Mark Topic as Read
- Float this Topic for Current User
- Bookmark
- Subscribe
- Mute
- Printer Friendly Page
Nyquist Im and Re axis from transfer function
Feb 17, 2014
03:59 PM
- Mark as New
- Bookmark
- Subscribe
- Mute
- Subscribe to RSS Feed
- Permalink
- Notify Moderator
Feb 17, 2014
03:59 PM
Nyquist Im and Re axis from transfer function
Hi,
I am trying to plot nyquist diagram of my transfer function. I dont know what could be wrong. There should be a nice curved diagram, and I get such a mess. Can anyone help please? MathCAD file is attached. Thank you.
7 REPLIES 7
Feb 17, 2014
04:35 PM
- Mark as New
- Bookmark
- Subscribe
- Mute
- Subscribe to RSS Feed
- Permalink
- Notify Moderator
Feb 17, 2014
04:35 PM
Are you sure about the "1 - e^..." in the denominator of y1(w)? Shouldn't it be simply 1 +/- s(w)*T ?? Or rather "e^..." without the "1 - " ??
Feb 17, 2014
04:39 PM
- Mark as New
- Bookmark
- Subscribe
- Mute
- Subscribe to RSS Feed
- Permalink
- Notify Moderator
Feb 17, 2014
04:39 PM
Yes, I am sure of that. I tried it also with your suggestion, but I didnt get the "nyquist curve".
Feb 17, 2014
05:03 PM
- Mark as New
- Bookmark
- Subscribe
- Mute
- Subscribe to RSS Feed
- Permalink
- Notify Moderator
Feb 17, 2014
05:03 PM
This denominator 1 - exp(-j*w*T) is getting zero(!) for every w which is an integer multiple of pi/16 (=2*pi/T) and your y1(w) is going high up to infinity that way, regardlesss of W(w). This happens quite often in the w range of 1 to 1000 and you have seen this effect already in the 3D-plots of your previous posts (the spikes). Because you set w to integer values you never get an w which makes the denominator to zero, but obviously you can't expect a smooth curve that way.
PS: Watch your plot for w:=0,0.0001 .. 1 (or 10, or 100) and look at the axis scales
Feb 17, 2014
05:13 PM
- Mark as New
- Bookmark
- Subscribe
- Mute
- Subscribe to RSS Feed
- Permalink
- Notify Moderator
Feb 17, 2014
05:13 PM
It's been a while since controls class, so I'm a bit rusty. I take it that W is your system (out/in)? So in that case, shouldn't you be looking at the real and imaginary parts of W? Is this close to what you're looking for?
Feb 17, 2014
06:35 PM
- Mark as New
- Bookmark
- Subscribe
- Mute
- Subscribe to RSS Feed
- Permalink
- Notify Moderator
Feb 17, 2014
06:35 PM
Have you considered using a log axis:
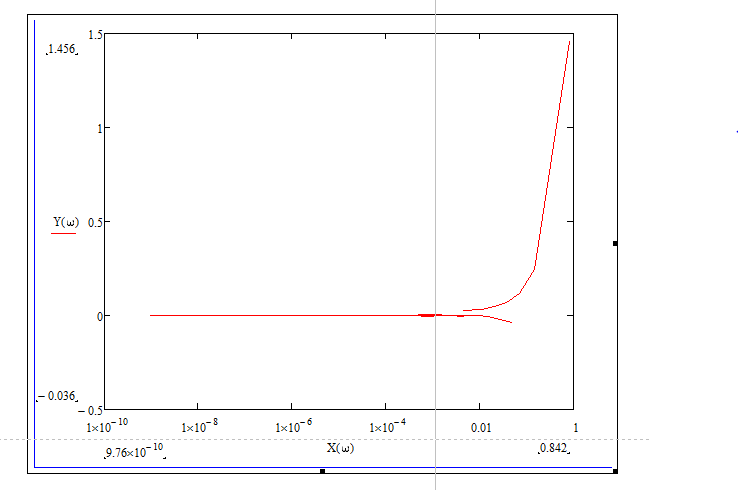
Feb 18, 2014
06:47 AM
- Mark as New
- Bookmark
- Subscribe
- Mute
- Subscribe to RSS Feed
- Permalink
- Notify Moderator
Feb 18, 2014
06:47 AM
I am affraid that it is not what I was expected, but Thank you.
BTW: How can I close discussion? Just by checking correct answer? Thx
Feb 18, 2014
11:08 AM
- Mark as New
- Bookmark
- Subscribe
- Mute
- Subscribe to RSS Feed
- Permalink
- Notify Moderator
Feb 18, 2014
11:08 AM
Did you look at Rogers post? Looks plausible to me.
You can't close a discussion literally. You may chose a post as the correct answer or chose "assume as answered" to indicate you don't need any help on the topic anymore.
Or you may comment on the various posts which tried to help telling why you think the correct output should be different. If you ask a question in any forum people usually will try to help, so you should come back yourself and show up. Your comments also may help others in the future who search the forum archive for a similar problem.
As your problem seems not to be solveed so far in your opinion you may either state that you are not interested in a solution anymore (cause the work is already overdue, e.g.) or provide additional information. Where are those equations coming from and how were they derived. What output do you want to duplicate, what kind of curve do you know is the correct one, etc.
Good luck!

