Turn on suggestions
Auto-suggest helps you quickly narrow down your search results by suggesting possible matches as you type.
Showing results for
Turn on suggestions
Auto-suggest helps you quickly narrow down your search results by suggesting possible matches as you type.
Showing results for
Community Tip - Your Friends List is a way to easily have access to the community members that you interact with the most! X
Options
- Subscribe to RSS Feed
- Mark Topic as New
- Mark Topic as Read
- Float this Topic for Current User
- Bookmark
- Subscribe
- Mute
- Printer Friendly Page
Overlaying Contour Plots
Jul 10, 2012
06:08 AM
- Mark as New
- Bookmark
- Subscribe
- Mute
- Subscribe to RSS Feed
- Permalink
- Notify Moderator
Jul 10, 2012
06:08 AM
Overlaying Contour Plots
Hi. Can someone give me a pointer to overlaying a sub contour plot on an already plotted contour. I want to illustrate graphically a region that is of particular interest to me.
Thanks
Jason
Solved! Go to Solution.
1 ACCEPTED SOLUTION
Accepted Solutions
Jul 10, 2012
08:43 AM
- Mark as New
- Bookmark
- Subscribe
- Mute
- Subscribe to RSS Feed
- Permalink
- Notify Moderator
Jul 10, 2012
08:43 AM
Jason Bryant wrote:
Hi. Can someone give me a pointer to overlaying a sub contour plot on an already plotted contour. I want to illustrate graphically a region that is of particular interest to me.
Do you mean something like the attached, Jason?
Unless you have some particular reason to have a mostly empty array, you are probably better off using x and y co-ordinate matrices to specify the x and y points rather than using the Axes limits.
Stuart
4 REPLIES 4
Jul 10, 2012
08:43 AM
- Mark as New
- Bookmark
- Subscribe
- Mute
- Subscribe to RSS Feed
- Permalink
- Notify Moderator
Jul 10, 2012
08:43 AM
Jason Bryant wrote:
Hi. Can someone give me a pointer to overlaying a sub contour plot on an already plotted contour. I want to illustrate graphically a region that is of particular interest to me.
Do you mean something like the attached, Jason?
Unless you have some particular reason to have a mostly empty array, you are probably better off using x and y co-ordinate matrices to specify the x and y points rather than using the Axes limits.
Stuart
Jul 10, 2012
09:47 AM
- Mark as New
- Bookmark
- Subscribe
- Mute
- Subscribe to RSS Feed
- Permalink
- Notify Moderator
Jul 10, 2012
09:47 AM
Thanks Stuart - I'd forgotten about the alternative notation to use for the graphic!
J
Jul 11, 2012
05:19 AM
- Mark as New
- Bookmark
- Subscribe
- Mute
- Subscribe to RSS Feed
- Permalink
- Notify Moderator
Jul 11, 2012
05:19 AM
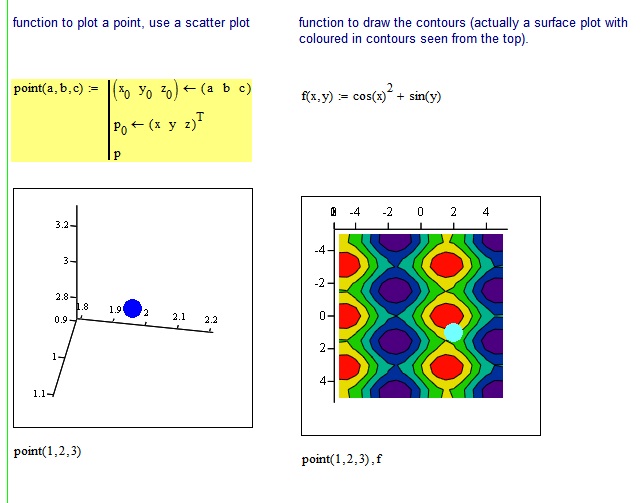
How would I add a single point onto the contour such that it was identified by a wavelength number i.e. the coordinate 540, 610 for example?
Thanks
Jason
Jul 11, 2012
07:35 AM
- Mark as New
- Bookmark
- Subscribe
- Mute
- Subscribe to RSS Feed
- Permalink
- Notify Moderator
Jul 11, 2012
07:35 AM
Jason Bryant wrote:
How would I add a single point onto the contour such that it was identified by a wavelength number i.e. the coordinate 540, 610 for example?
Thanks
Jason
Try the attached, Jason.
Stuart