- Subscribe to RSS Feed
- Mark Topic as New
- Mark Topic as Read
- Float this Topic for Current User
- Bookmark
- Subscribe
- Mute
- Printer Friendly Page
Phase Plot Error - Bode Diagrams
- Mark as New
- Bookmark
- Subscribe
- Mute
- Subscribe to RSS Feed
- Permalink
- Notify Moderator
Phase Plot Error - Bode Diagrams
Hello,
I encountered a problem with the Bode Diagrams...
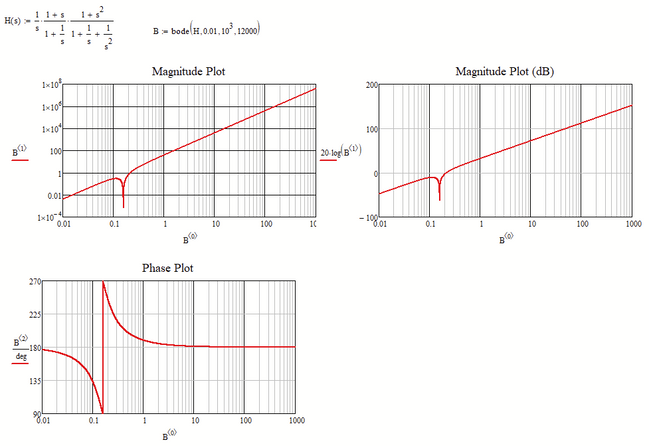
How can correct the Phase Plot of the Bode Diagrams for a system which has, for example and simplicity, two poles in origins?
The Phase Plot shows that the system has a +180 degree which is not correct. The system should have a -180 degree.
Thank you.
Solved! Go to Solution.
- Labels:
-
Electrical_Engineering
-
Mathcad Usage
- Mark as New
- Bookmark
- Subscribe
- Mute
- Subscribe to RSS Feed
- Permalink
- Notify Moderator
2) The two systems are separate (just for simplicity), but what should I do if I will have a system like this:
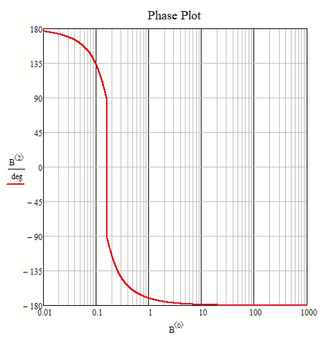
One suggestion would be this:
And if you prefer a different range for the angles you may simply add or subtract 2 pi:
Or you may prefer something like this:
I have to admit the last one was a little cheated 😉
But it could be implemented "legally" using Freds approach. Of course this also means that you would have to provide the factors of your transfer function one by one in a vector.
- Mark as New
- Bookmark
- Subscribe
- Mute
- Subscribe to RSS Feed
- Permalink
- Notify Moderator
Can you post the Mathcad 15.0 (M50) file with these results and implementation?
- Mark as New
- Bookmark
- Subscribe
- Mute
- Subscribe to RSS Feed
- Permalink
- Notify Moderator
The sheet with the "bode" function (written in different ways) was already posted by me some time ago in this thread. You simply have to drop your transfer function into it.
The last pic was, as I had written, done by cheating - I had manually split the phase vector into two parts and subtracted 2pi from the second one 😉
Maybe I find time to implement Freds idea into this function.
- Mark as New
- Bookmark
- Subscribe
- Mute
- Subscribe to RSS Feed
- Permalink
- Notify Moderator
@Werner_E, @LucMeekes, @Fred_Kohlhepp
Can you take a look at this Mathcad file?
What is your opinion about this pattern?
- Mark as New
- Bookmark
- Subscribe
- Mute
- Subscribe to RSS Feed
- Permalink
- Notify Moderator
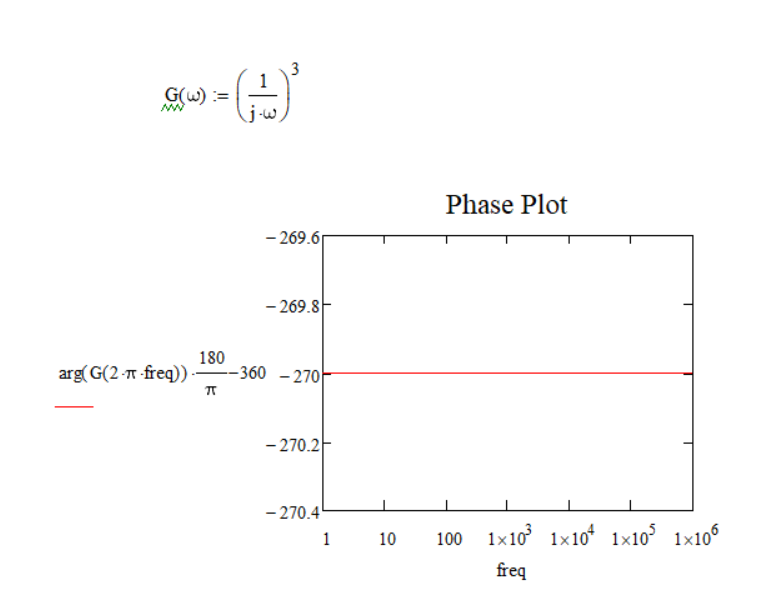
This file has the same issue as the original post: the "arg" function can only discriminate over a 360° range. You can alter that range, but you can't expand it. Having a transfer function that consists of multiple copies of the same factor will recycle inside the 360° constraint:
This is what your sheet displays.
The cute little programming trick that was inserted to allow a continuous phase trace
does not work because the phase is constant independent of frequency.
The only way I can see to solve this is to factor the transfer function and sum the phase shift of the factors. This will only work if each factor cannot be factored further.
- Mark as New
- Bookmark
- Subscribe
- Mute
- Subscribe to RSS Feed
- Permalink
- Notify Moderator
would appreciate it if someone could post a Mathcad 11 version of the file.
Thanks,
Lou
- Mark as New
- Bookmark
- Subscribe
- Mute
- Subscribe to RSS Feed
- Permalink
- Notify Moderator
Sorry, can't do that. But it's not large:
One program block:
Then a series of
Where H1 is (1/s^1), H2 is (1/s^2), etc.
- Mark as New
- Bookmark
- Subscribe
- Mute
- Subscribe to RSS Feed
- Permalink
- Notify Moderator
@Cornel wrote:
@Werner_E, @LucMeekes, @Fred_Kohlhepp
Can you take a look at this Mathcad file?
What is your opinion about this pattern?
I am not sure what you are trying to show!?
Of course simply subtracting 2pi from the result of the arg function won't give you the same result as Matlab for all examples. It looks like you still don't understand that arg will only give you angles from -pi to +pi and subtraction of 2pi will just give you angles in the range from -3 pi to -p, excluding -3pi. Thats all!
You would have to adjust the summand yourself for every function to get the result you think you must get.
Fred and LouP have explained the main problem in their answers here. Matlab somehow is able to split the transfer function into its factors and calculates the phase for each one and then adds them. thats the reason why 1/s^7 gives you a phase of 7*(-pi/2) = -630°.
Mathcad just sees the (complex) result no matter how the function is constructed. I don't think that Mathcad is able to automatically split the function in its factors and treats every factor separate.
You may try the new bode function I just posted (look at the end of this thread) which has Freds idea implemented. It also won't be automatic as you would have to provide the factors of transfer function yourself. I can't think of a way to automate it.
- Mark as New
- Bookmark
- Subscribe
- Mute
- Subscribe to RSS Feed
- Permalink
- Notify Moderator
I think the following excerpt - below G6(w) - from Andrew's 09-11-2020, 3:37AM post contains the crux of the mismatch between his question and most of the responses:
"Because now the system has 3 poles at origins, the Phase Plot should have -270 degrees (-90 degrees for the first pole + -90 degrees for the second pole + -90 degrees for the third pole = -270 degrees). which in Matlab I can see that but not yet in Mathcad."
The only way that a Matlab (or any other ) program can produce distinct phase values for j^3 and (1/j) is to have knowledge "under the hood," so that the program knows that one function has three numerator factors and the other one denominator factor. I would surmise that the Matlab program computes phase on a factor-by-factor basis, and not by a single phase calc on the end value. The latter must give the same values for both.
The attached pdf gives more detail. My conclusion is that the desired result is only possible if the factors of the transfer function are known, or can be determined.
Lou
- Mark as New
- Bookmark
- Subscribe
- Mute
- Subscribe to RSS Feed
- Permalink
- Notify Moderator
I think you got to the point with that. And that is also Fred's approach to specify the factors of the transfer function individually within a vector.
I don't think that Prime will be able to factor that automatically.
- Mark as New
- Bookmark
- Subscribe
- Mute
- Subscribe to RSS Feed
- Permalink
- Notify Moderator
I think that one suggestion from @LucMeekes from the previous comment seems to be good:
Now the question is:
Is this variant/technique correct/valid to apply in any situation or case in Mathcad?
- Mark as New
- Bookmark
- Subscribe
- Mute
- Subscribe to RSS Feed
- Permalink
- Notify Moderator
Now the question is:
Is this variant/technique correct/valid to apply in any situation or case in Mathcad?
That depends on your definition of "correct/valid"!
In the discussion here it was often enough said that +180° is as valid and correct as -180°.
The method you are referring to now will give you angles in the domain from -540° to -180° excluding -540°. You have to decide if thats what you want.
- Mark as New
- Bookmark
- Subscribe
- Mute
- Subscribe to RSS Feed
- Permalink
- Notify Moderator
Good.
Thank you all three ( @LucMeekes , @Werner_E and @Fred_Kohlhepp ) for involvement, ideas and support.
( In the future If you have other ideas or suggestions for this topic you can post them. )
- Mark as New
- Bookmark
- Subscribe
- Mute
- Subscribe to RSS Feed
- Permalink
- Notify Moderator
What Fred was pointing you to was that the result of your transfer function 1/s^2 never yields an imaginary part. All results are reals, to be more precisely, they are all negative numbers. And the phase of a negative number is 190 degree (or -180 degree, or 540 degree, or ...)
So the plot with +180° is perfectly correct for this transfer function.
If you wan to see -180°, you would have to write your own "arg" function which returns the values in the range you'd like to see. Maybe all it needs is to change arg so that it still acts in the domain -pi to +pi but excluding +pi (and not -pi). Luc already showed a way to implement this.
BTW, you don't have to use a different name for the new "arg" function like "Arg", you may name it still "arg" and effectively overrule the built-in function that way.
- Mark as New
- Bookmark
- Subscribe
- Mute
- Subscribe to RSS Feed
- Permalink
- Notify Moderator
Yes, you and @LucMeekes are right when you say that the value of +180 degrees is correct, but that's not what I am interested in. Which interests me is what can do to show the graph, not at +180 degrees but at -180 degrees.
If I had known the answer (i.e. what to do so the plot can show me -180 degrees instead of +180 degrees (which also the last value (+180 degrees) is correct) I would not have posted this subject:)). But I did not know, so I asked.
- Mark as New
- Bookmark
- Subscribe
- Mute
- Subscribe to RSS Feed
- Permalink
- Notify Moderator
But you were already given the solution multiple times !!??
- Mark as New
- Bookmark
- Subscribe
- Mute
- Subscribe to RSS Feed
- Permalink
- Notify Moderator
But jw is an imaginary part.
True, and when you square it the result is a negative number (if w is positive at least). So the real part is negative and the imaginary part is zero. and that makes the phase 180 degrees if we're measuring from the x axis counterclockwise. (It also happens to be -180°, too.)
- Mark as New
- Bookmark
- Subscribe
- Mute
- Subscribe to RSS Feed
- Permalink
- Notify Moderator
That's right.
I didn't square up in my previous post.
Sorry.
- Mark as New
- Bookmark
- Subscribe
- Mute
- Subscribe to RSS Feed
- Permalink
- Notify Moderator
@Cornel wrote:
But what factor do I need to add to arg(x) to change to the range/width to 0-360 degrees?
Luc already showed a way how to do it.
But if you want that arg(x) returns a value phi in the range 0 <= phi < 360°, you will newer get a value of -180° which you said that you'd like to see ??
So you have to decide about the range the result should be in.
By default its ]-180°; +180°] and so you never will see -180°.
Lucs first suggestion gives you values in [0; 360°[, only positive values or zero.
Lucs last suggestion gives you values in [-180°; +180°[. Note the difference in brackets compared to the standard setting. You get the same values as with the original "arg", the only difference is that a negative real argument will yield -180° instead of +180°. You can alternatively use Arg(x):=if(arg(x)=pi,-pi,arg(x))
You might also create Arg-function to return values in ]-270°,90°] or any range covering "a full circle". You have to decide.
You may decide for
- Mark as New
- Bookmark
- Subscribe
- Mute
- Subscribe to RSS Feed
- Permalink
- Notify Moderator
This discussion is already far too confusing and the forum software unfortunately does not provide any useful means to find your way more easily in a longer and branched thread.
Therefore I am answering directly to the first entry to put this answer at the end.
I was asked to send the file with the bode function again, so I revised it and added Fred's idea of transferring the factors of the transfer function individually in a field.
The phase correction (eg by "phasecor") does not always seem to make sense and therefore the bode function now offers the option with the last argument to activate it (or not).
Perhaps the function can be useful to one or the other - have fun with it.
MC15 worksheet and pdf-print attached
- Mark as New
- Bookmark
- Subscribe
- Mute
- Subscribe to RSS Feed
- Permalink
- Notify Moderator
Here is the Mathcad 11 version of the file just posted.
EDIT:
Added replacements for "phase" and "phasecor"
- « Previous
-
- 1
- 2
- Next »


