
Turn on suggestions
Auto-suggest helps you quickly narrow down your search results by suggesting possible matches as you type.
Showing results for
Turn on suggestions
Auto-suggest helps you quickly narrow down your search results by suggesting possible matches as you type.
Showing results for
Community Tip - You can change your system assigned username to something more personal in your community settings. X
Options
- Subscribe to RSS Feed
- Mark Topic as New
- Mark Topic as Read
- Float this Topic for Current User
- Bookmark
- Subscribe
- Mute
- Printer Friendly Page
Plotting Point
Dec 10, 2013
11:51 AM
- Mark as New
- Bookmark
- Subscribe
- Mute
- Subscribe to RSS Feed
- Permalink
- Notify Moderator
Dec 10, 2013
11:51 AM
Plotting Point
Hi,
I would like to use MP3 2D plot, like we use to do in the good old days?
I have points
x=(10,0)
Y=(10,20)
and so one r, e, h, etc...
how can I input these point into the plot
and how can I connect these points by lines?
I hope it will not be a complicated procedure:)
Regards,
H
Solved! Go to Solution.
Labels:
- Labels:
-
Other
1 ACCEPTED SOLUTION
Accepted Solutions
Dec 11, 2013
12:35 PM
- Mark as New
- Bookmark
- Subscribe
- Mute
- Subscribe to RSS Feed
- Permalink
- Notify Moderator
Dec 11, 2013
12:35 PM
I'll try my best.
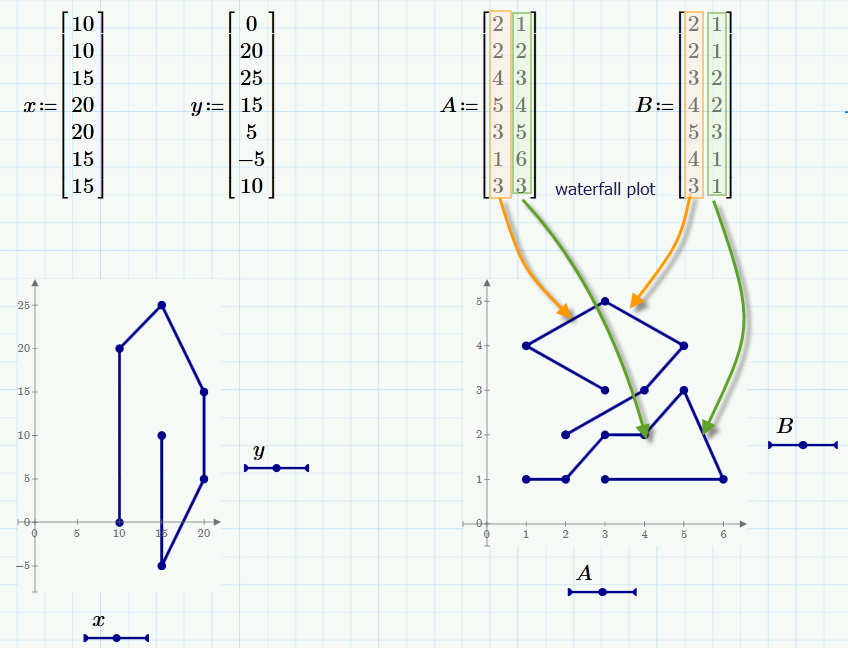
In my first reply you saw that we can draw points and connect them if we simply plot a vector of y-coordinates over the corresponding vector of x-coordinates. In the plot formatting ribbon we can then select, color, line style and thickness (or if we want the dots connected at all), if we want to see the points and what symbol. Unfortunately we cannot set linethickness and size of the point symbol separately.
In the new sheet I created the data in a n x 2 matrix. The first column being the x-coordinates and the second the y-coordinates. In the plot region you see that I selected the appropriate column using the column-selector you get by pressing ctrl-shift-C.
I also made use of NaN. This stands for "Not-a-Number" and has the effect in 2D-plots that the connection between the points is broken. Much like a "penup" command in a turtle-like drawing program. For my convenienceI I had setup a 1x2 row of NaN's and called this stop.
Next thing I used was the stack command. This command does what it says, it stacks matrices or scalars one on top of the other. This allows me to develop the datastructure for the full plot step by step.
Lets say I create a 3x2 Matrix A representing 3 points forming an "L", top of the "L" is the first line. Then I create a 1x2 matrix B representing a single point, lets say in the upper right over the lower right point of the "L". So C:=stack(A,B) will create a datastrucure which looks like an "U" if plotted.
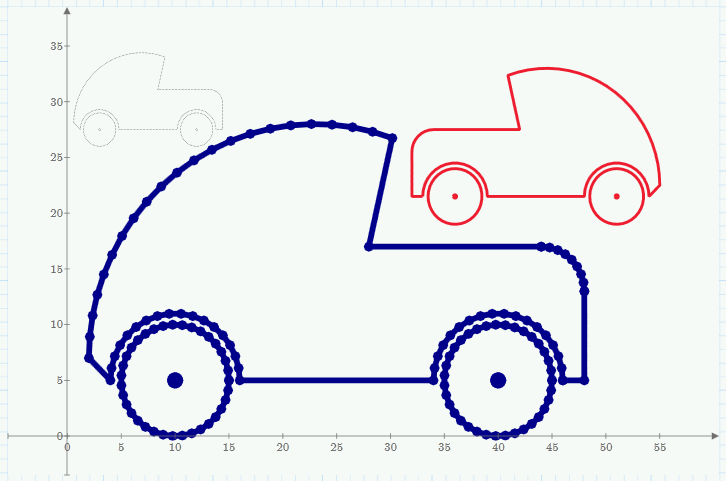
Last thing is the arc routine. It returns a 2-column matrix of point coordinates which form (part) of a circle. The function has 6 parameters:
- x-coordinate of the center of the circle
- y-coordinate of the center of the circle
- radius of the circle
- starting angle (0 is at the right, counter clockwise measured, so 90° is at the top)
- ending angle
- number of points which should be created
You may create similar routines like arc to return different shapes. For an ellipse you would add just two additional parameters (half the minor axis and the angle of the major axis e.g.) and change the equations accordingly.
You may draw circuit diagrams and make routines for capacity, resistor and coil/inductivity. But who would do that? Its nice we could do it, but thats sure not what Mathcad is made for.
HinndNaser wrote:
That is what I am looking for actually, but the one I am doing doesnt end up being cars:),
Hmm, isn't it a baby stroller? 🙂
So what is it you will end up with?
9 REPLIES 9
Dec 10, 2013
12:24 PM
- Mark as New
- Bookmark
- Subscribe
- Mute
- Subscribe to RSS Feed
- Permalink
- Notify Moderator
Dec 10, 2013
12:24 PM
Doesn't it work the same as in the good old days of Mathcad (15 and below)?
Plotting the vector of ordinates over the vector of abscissa values.
Or am i missing the point?
Maybe you should provide a worksheet including the data you want to plot.
Dec 10, 2013
12:31 PM
- Mark as New
- Bookmark
- Subscribe
- Mute
- Subscribe to RSS Feed
- Permalink
- Notify Moderator
Dec 10, 2013
12:31 PM
I should have explaind, the good old days is when you have a graph paper:) and a pencil to draw a line connecting two points.
Dec 10, 2013
12:50 PM
- Mark as New
- Bookmark
- Subscribe
- Mute
- Subscribe to RSS Feed
- Permalink
- Notify Moderator
Dec 10, 2013
12:50 PM
Is it something like this you are after?
You will have to sparate x- and y-coordinates of your points.
Dec 10, 2013
12:59 PM
- Mark as New
- Bookmark
- Subscribe
- Mute
- Subscribe to RSS Feed
- Permalink
- Notify Moderator
Dec 10, 2013
12:59 PM
Actuly, yes, thank you
Another question, what if the connection for some of these points are arc instead of a line, say quarter of a circle?
what would you do?
Regards,
Dec 10, 2013
02:03 PM
- Mark as New
- Bookmark
- Subscribe
- Mute
- Subscribe to RSS Feed
- Permalink
- Notify Moderator
Dec 10, 2013
02:03 PM
You may use a spline interpolation to connect the data points mor smoothly. But for doing so, the x-values would have to be in ascending order (which is not the case in the examples given.
What would i do if i wanted to draw a circle or a quarter of it? There are various ways but I guess I'd prefer a parametric functional representation.
Dec 10, 2013
03:08 PM
- Mark as New
- Bookmark
- Subscribe
- Mute
- Subscribe to RSS Feed
- Permalink
- Notify Moderator
Dec 10, 2013
03:08 PM
HinndNaser wrote:
Another question, what if the connection for some of these points are arc instead of a line, say quarter of a circle?
You know that Mathcad is not a drawing program? It will plot "just" functions and vectors/matrices.
Dec 11, 2013
11:55 AM
- Mark as New
- Bookmark
- Subscribe
- Mute
- Subscribe to RSS Feed
- Permalink
- Notify Moderator
Dec 11, 2013
11:55 AM
That is what I am looking for actually, but the one I am doing doesnt end up being cars:), but I am not that advanced in MP3, do you mind to explain this programe further.
Regards,
Dec 11, 2013
12:35 PM
- Mark as New
- Bookmark
- Subscribe
- Mute
- Subscribe to RSS Feed
- Permalink
- Notify Moderator
Dec 11, 2013
12:35 PM
I'll try my best.
In my first reply you saw that we can draw points and connect them if we simply plot a vector of y-coordinates over the corresponding vector of x-coordinates. In the plot formatting ribbon we can then select, color, line style and thickness (or if we want the dots connected at all), if we want to see the points and what symbol. Unfortunately we cannot set linethickness and size of the point symbol separately.
In the new sheet I created the data in a n x 2 matrix. The first column being the x-coordinates and the second the y-coordinates. In the plot region you see that I selected the appropriate column using the column-selector you get by pressing ctrl-shift-C.
I also made use of NaN. This stands for "Not-a-Number" and has the effect in 2D-plots that the connection between the points is broken. Much like a "penup" command in a turtle-like drawing program. For my convenienceI I had setup a 1x2 row of NaN's and called this stop.
Next thing I used was the stack command. This command does what it says, it stacks matrices or scalars one on top of the other. This allows me to develop the datastructure for the full plot step by step.
Lets say I create a 3x2 Matrix A representing 3 points forming an "L", top of the "L" is the first line. Then I create a 1x2 matrix B representing a single point, lets say in the upper right over the lower right point of the "L". So C:=stack(A,B) will create a datastrucure which looks like an "U" if plotted.
Last thing is the arc routine. It returns a 2-column matrix of point coordinates which form (part) of a circle. The function has 6 parameters:
- x-coordinate of the center of the circle
- y-coordinate of the center of the circle
- radius of the circle
- starting angle (0 is at the right, counter clockwise measured, so 90° is at the top)
- ending angle
- number of points which should be created
You may create similar routines like arc to return different shapes. For an ellipse you would add just two additional parameters (half the minor axis and the angle of the major axis e.g.) and change the equations accordingly.
You may draw circuit diagrams and make routines for capacity, resistor and coil/inductivity. But who would do that? Its nice we could do it, but thats sure not what Mathcad is made for.
HinndNaser wrote:
That is what I am looking for actually, but the one I am doing doesnt end up being cars:),
Hmm, isn't it a baby stroller? 🙂
So what is it you will end up with?
Dec 23, 2013
11:31 AM
- Mark as New
- Bookmark
- Subscribe
- Mute
- Subscribe to RSS Feed
- Permalink
- Notify Moderator
Dec 23, 2013
11:31 AM
Thank you 

