
Turn on suggestions
Auto-suggest helps you quickly narrow down your search results by suggesting possible matches as you type.
Showing results for
Turn on suggestions
Auto-suggest helps you quickly narrow down your search results by suggesting possible matches as you type.
Showing results for
Community Tip - Your Friends List is a way to easily have access to the community members that you interact with the most! X
Options
- Subscribe to RSS Feed
- Mark Topic as New
- Mark Topic as Read
- Float this Topic for Current User
- Bookmark
- Subscribe
- Mute
- Printer Friendly Page
Plotting a crystal in Mathcad
Nov 19, 2013
02:07 PM
- Mark as New
- Bookmark
- Subscribe
- Mute
- Subscribe to RSS Feed
- Permalink
- Notify Moderator
Nov 19, 2013
02:07 PM
Plotting a crystal in Mathcad
Hello guys,
I have a question about ploting a crystal in Mathcad. In general crystal is made by translation of unit cell in a periodical way along x,y,z for some increment a, b, c. The a, b and c determine the size of unit cell, while x, y and z can be at some angle: alpha, beta, gamma (see attached figure).
Lets say that crystal is rock salt (NaCl). Then Na and Cl atoms are positioned within unit cell in some regular manner. The plotting of one unit cell in a form of 3D plot in Mathcad is simple, but I am curious how to create a crystal of desired size? I guess it has to do something with vectors.
Thanks,
Goran
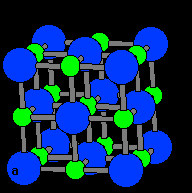
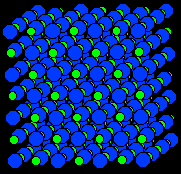
NaCl unit cell NaCl crystal - 3x3 unit cells
Solved! Go to Solution.
1 ACCEPTED SOLUTION
Accepted Solutions
Nov 19, 2013
06:28 PM
- Mark as New
- Bookmark
- Subscribe
- Mute
- Subscribe to RSS Feed
- Permalink
- Notify Moderator
Nov 19, 2013
06:28 PM
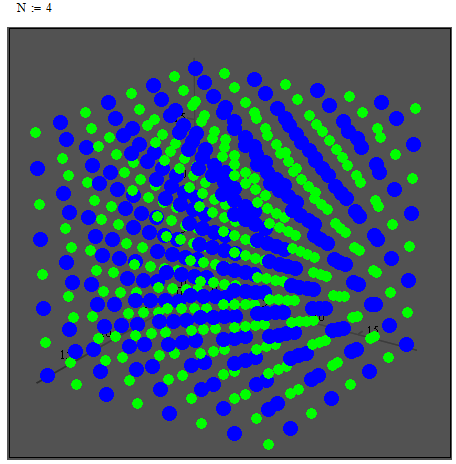
Maybe something like the attached could help.
You can control the direction of translation with the three vectors in the sheet.
5 REPLIES 5
Nov 19, 2013
02:44 PM
- Mark as New
- Bookmark
- Subscribe
- Mute
- Subscribe to RSS Feed
- Permalink
- Notify Moderator
Nov 19, 2013
02:44 PM
The plotting of one unit cell in a form of 3D plot in Mathcad is simple,
Really? So lets see what you have done so far and attach your worksheet.
That way we also would see what Mathcad version the question is related to.
Nov 19, 2013
05:06 PM
- Mark as New
- Bookmark
- Subscribe
- Mute
- Subscribe to RSS Feed
- Permalink
- Notify Moderator
Nov 19, 2013
05:06 PM
Hi,
Above I've just provided a general description of a problem. What follows is the Mathcad15 file with NaCl crystal as an example.
Thanks!
Nov 19, 2013
05:15 PM
- Mark as New
- Bookmark
- Subscribe
- Mute
- Subscribe to RSS Feed
- Permalink
- Notify Moderator
Nov 19, 2013
05:15 PM
So you do not show the connections/bindings and you do not model the atoms as spheres. That way they won't scale and you would have to manually scale the size down with increasing numer of cells.
While it should be possible to write routines which create the necessary vectors (at least for the orthogonal case, I don't think that Mathcad is the right tool for this task.
BTW, what your sheet shows is not the full unit cell, right? At least not according to the pictures you added in your first post.
Nov 19, 2013
05:34 PM
- Mark as New
- Bookmark
- Subscribe
- Mute
- Subscribe to RSS Feed
- Permalink
- Notify Moderator
Nov 19, 2013
05:34 PM
There is no need to present atoms as spheres or to draw bonds between them. The data point present only a position of an atom within a unit cell. This is sufficient for visualisation.
Werner Exinger wrote:
So you do not show the connections/bindings and you do not model the atoms as spheres. That way they won't scale and you would have to manually scale the size down with increasing numer of cells.
While it should be possible to write routines which create the necessary vectors (at least for the orthogonal case, I don't think that Mathcad is the right tool for this task.
BTW, what your sheet shows is not the full unit cell, right? At least not according to the pictures you added in your first post.
1. The scaling is not a problem. In any case this shouldn't go above 5x5 unit cells, so it would be still nicely visible in graph i.e. 3D plot.
2. The unit cell I created and the one in an image provided earlier are esentially the same. Due to simmetry when you perform translation of unit cell I created along the axes at the end you will get the same image.
So, how complicated it is to write routines for vectors that will represent axes? It is important that one can plot them i.e. that these vectors are axes instead of standard X,Y,Z.
Nov 19, 2013
06:28 PM
- Mark as New
- Bookmark
- Subscribe
- Mute
- Subscribe to RSS Feed
- Permalink
- Notify Moderator
Nov 19, 2013
06:28 PM
Maybe something like the attached could help.
You can control the direction of translation with the three vectors in the sheet.

