
Turn on suggestions
Auto-suggest helps you quickly narrow down your search results by suggesting possible matches as you type.
Showing results for
Turn on suggestions
Auto-suggest helps you quickly narrow down your search results by suggesting possible matches as you type.
Showing results for
Community Tip - Learn all about PTC Community Badges. Engage with PTC and see how many you can earn! X
Options
- Subscribe to RSS Feed
- Mark Topic as New
- Mark Topic as Read
- Float this Topic for Current User
- Bookmark
- Subscribe
- Mute
- Printer Friendly Page
Reading Excel Table Vs Range variable usage
Jul 09, 2021
12:36 PM
- Mark as New
- Bookmark
- Subscribe
- Mute
- Subscribe to RSS Feed
- Permalink
- Notify Moderator
Jul 09, 2021
12:36 PM
Reading Excel Table Vs Range variable usage
@LucMeekes ....With your help from my previous post , I was able create a n excel table based on the timing matrix (both attached, plot the waveform and then calculated average Power dissipation in a cycle...
Can i do the same plot and find average using range variable(from time vs power matrix), there by i can skip the excel part of it?
Can you show me an example?
Thank you
Jacob
Solved! Go to Solution.
Labels:
- Labels:
-
Electrical_Engineering
-
Mathcad Usage
1 ACCEPTED SOLUTION
Accepted Solutions
Jul 17, 2021
04:31 AM
- Mark as New
- Bookmark
- Subscribe
- Mute
- Subscribe to RSS Feed
- Permalink
- Notify Moderator
Jul 17, 2021
04:31 AM
Programming lesson of data set.
From csv Data, programming makes Power Table data Ans as shown below.
But this is only for this data set and if the data has noises it becomes more difficult.
Therefore, this is only the first step to make table data.
Tokoro.


7 REPLIES 7
Jul 09, 2021
08:52 PM
- Mark as New
- Bookmark
- Subscribe
- Mute
- Subscribe to RSS Feed
- Permalink
- Notify Moderator
Jul 09, 2021
08:52 PM
From csv data, you can use mean function.


Jul 15, 2021
06:01 PM
- Mark as New
- Bookmark
- Subscribe
- Mute
- Subscribe to RSS Feed
- Permalink
- Notify Moderator
Jul 15, 2021
06:01 PM
@ttokoro .....Thanks for trying help me...
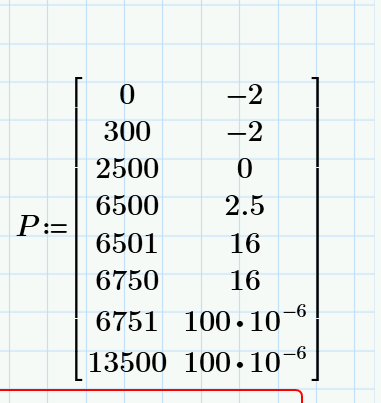
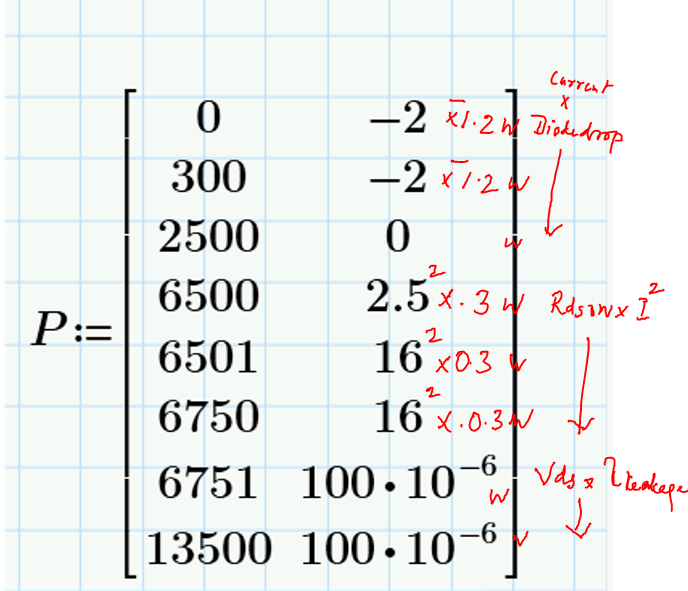
I generated the excel file from the attached time vs power matrix
Here my question is with out generating the excel file, Is it possible to find the average power , from the attached matrix , using Range variable?
@ttokoro ...In your attached file with programming the power extends in to negative region(quadrant 4). We cannot do that. That will give us error. I in the attached excel file you can see that i multiplied. I corrected the Matrix to look like the excel table. New matrix attached
@LucMeekes ...Please help if possible
Jul 15, 2021
08:08 PM
- Mark as New
- Bookmark
- Subscribe
- Mute
- Subscribe to RSS Feed
- Permalink
- Notify Moderator
Jul 15, 2021
08:08 PM
Only change the table data what you want.
If you want to

The table data should be below, that is readable from your csv data.

Jul 16, 2021
10:32 AM
- Mark as New
- Bookmark
- Subscribe
- Mute
- Subscribe to RSS Feed
- Permalink
- Notify Moderator
Jul 16, 2021
10:32 AM
@ttokoro ...your detailed explanation in resolving it thru programming is highly appreciated. I am still looking to see someone can help me resolve this thru range variables
Jul 16, 2021
02:08 PM
- Mark as New
- Bookmark
- Subscribe
- Mute
- Subscribe to RSS Feed
- Permalink
- Notify Moderator
Jul 16, 2021
02:08 PM
I guess this is sort of what you are looking for:

Attached is a Prime 4 file.
Success!
Luc
Jul 16, 2021
03:12 PM
- Mark as New
- Bookmark
- Subscribe
- Mute
- Subscribe to RSS Feed
- Permalink
- Notify Moderator
Jul 16, 2021
03:12 PM
This is great job...
I was expecting a little bit more simpler solution where range variable s splitting different sections in the plot as per matrix and then combining these sections in the plot , after that find the average from plot...Once again thanks a lot for helping. Corrected matrix included
Jul 17, 2021
04:31 AM
- Mark as New
- Bookmark
- Subscribe
- Mute
- Subscribe to RSS Feed
- Permalink
- Notify Moderator
Jul 17, 2021
04:31 AM
Programming lesson of data set.
From csv Data, programming makes Power Table data Ans as shown below.
But this is only for this data set and if the data has noises it becomes more difficult.
Therefore, this is only the first step to make table data.
Tokoro.

