Turn on suggestions
Auto-suggest helps you quickly narrow down your search results by suggesting possible matches as you type.
Showing results for
Turn on suggestions
Auto-suggest helps you quickly narrow down your search results by suggesting possible matches as you type.
Showing results for
Community Tip - Did you know you can set a signature that will be added to all your posts? Set it here! X
Options
- Subscribe to RSS Feed
- Mark Topic as New
- Mark Topic as Read
- Float this Topic for Current User
- Bookmark
- Subscribe
- Mute
- Printer Friendly Page
Scatter Points with varied color for each point in 3D plot
Feb 22, 2014
06:47 AM
- Mark as New
- Bookmark
- Subscribe
- Mute
- Subscribe to RSS Feed
- Permalink
- Notify Moderator
Feb 22, 2014
06:47 AM
Scatter Points with varied color for each point in 3D plot
Hi Smart you,
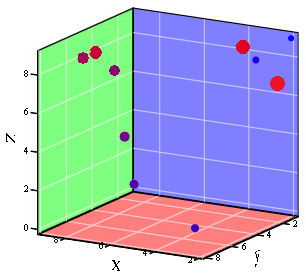
I ploted 10 scatter points in a 3D scatter plot.
The data for 100 points is like this:
step x y z
1 x1 y1 z1
2 x2 y2 z2
.
.
.
10 x10 y10 z10
My quetion is: Is there anyway that I can specify different colors to these 10 points in a way that the color changes from blue to red as Point Id is from 1 to 10? I would love to approximate the point ID by visually reading from varied colors.
Message was edited by: matthew zhou
1 REPLY 1
Feb 22, 2014
07:24 AM
- Mark as New
- Bookmark
- Subscribe
- Mute
- Subscribe to RSS Feed
- Permalink
- Notify Moderator
Feb 22, 2014
07:24 AM
What you demand unfortunately is not available in Mathcads plot. There are two workarounds which come to mind, none of hem being perfect.
1) In the plot format menu you can chose tab Appearence and change "Color Options" to colormap. In tab Advanced you can chose a colormap and also what the map should be related to. This is usually the height (z) but there is no option to use the order of the points for that purpose.,
2) You plot ever point separatly and format its color (and size) individually. The method is practical if the number of points doesn't change.