
Turn on suggestions
Auto-suggest helps you quickly narrow down your search results by suggesting possible matches as you type.
Showing results for
Turn on suggestions
Auto-suggest helps you quickly narrow down your search results by suggesting possible matches as you type.
Showing results for
Community Tip - You can Bookmark boards, posts or articles that you'd like to access again easily! X
Options
- Subscribe to RSS Feed
- Mark Topic as New
- Mark Topic as Read
- Float this Topic for Current User
- Bookmark
- Subscribe
- Mute
- Printer Friendly Page
Understanding issue
Nov 27, 2013
07:06 AM
- Mark as New
- Bookmark
- Subscribe
- Mute
- Subscribe to RSS Feed
- Permalink
- Notify Moderator
Nov 27, 2013
07:06 AM
Understanding issue
Hi everybody,
Im really struggling with this MathCad worksheet that I have to do!
We have a foreign lecturer and I struggle to understand him!
So if someone could walk me through this that would be very helpful!
I do want to understand it though
I have attached the file below:)
I should note I use MathCad 15:)
thanks in advanced!
17 REPLIES 17
Nov 27, 2013
08:47 AM
- Mark as New
- Bookmark
- Subscribe
- Mute
- Subscribe to RSS Feed
- Permalink
- Notify Moderator
Nov 27, 2013
08:47 AM
This looks suspiciously like a homework assignment.
Typically, we'll be happy to help, but we won't do your work for you. So fire up your version 15 and then send us your attempt. (I didn't detect any accent in the english on the paper, so the instructions are clear.)
Get to work!
Nov 27, 2013
09:12 AM
- Mark as New
- Bookmark
- Subscribe
- Mute
- Subscribe to RSS Feed
- Permalink
- Notify Moderator
Nov 27, 2013
09:12 AM
OF course that's not what I want! I did say in my question that I want to understand it! I don't mean for people to do my work for me! I perhaps should have expressed that!
Anyways I have a worksheet done but I'm already stumped with the input of the table and labelling the axis.
also my issue was with us being taught this stuff to then do an assignment on, we have lectures and then practice sessions and it's the lectures I struggle to understand and then apply in the practice session!
I will load my MathCad file when I get home and load up my laptop:)
Cheers 
Nov 27, 2013
11:20 AM
- Mark as New
- Bookmark
- Subscribe
- Mute
- Subscribe to RSS Feed
- Permalink
- Notify Moderator
Nov 27, 2013
11:20 AM
I agree with Fred that you should post a worksheet with your attempts first. But as you write that you already stumped with the task of creating the two vectors X and Y it seemed that something went wrong.
What do you mean with labelling the axis? Are you having difficulties in plotting one vector against the other? (its very similar as in your last question concerning the ODE).
Or is it simply that you think you must create a table looking exactly like the one given in the pdf you posted? And with "axis label" you mean the column header (x y)?
You sure are not supposed to do so and table given sure was not created using Mathcad but using the table facility of the wordprocesser used to create the document.
You may create a 12x1 vector for each of x and y or a 12x2 matrix to hold both in one variable. Given that later you are instructed to read sample data via READPRN (which sure will be a n x 2 matrix) I would advise to use a 12x2 matrix for the sample data.
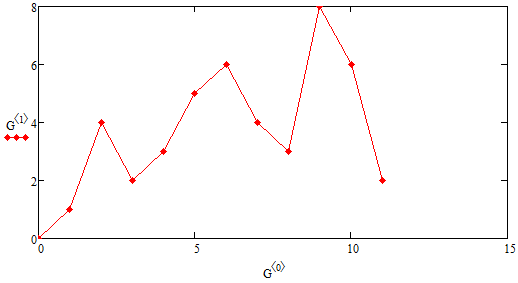
The routine you will have to write will have the n x 2 matrix as parameter (input) and will return a m x 2 matrix containing the x- and y-coordinates of the relative maxima. You are supposed to reason how to decide that a data point is a relative maximum by looking at its neighbours. After you have done that, you will have to loop through the data and collect the ordinate and abscissa values in the return matrix.
So you will have to answer the question: How do you describe/define a local maximum. You also have to take into acount special cases like the first and last data point or the situation, where two or more consecutive datapoints have the same y-value.
Test cases:
1-2-4-3-2 you sure would call 4 a local max
4-3-2-1-2 should 4 be considered a local max?
1-2-4-4-3 do we have a local max, or two, or none?
4-4-4-4-4 ?
1-2-4-4-5 ?
5-4-4-4-6 sure you won't call any of the 4's a maximum, but you can't decide that for the center 4 if you just look at its two neighbours!
4-4-4-5-6 same as above
You need to clarify if you are supposed to implement all of these case and how. Maybe you are lucky and allowed to assume that no two consecutive Y-values are the same.
Nov 27, 2013
05:32 PM
- Mark as New
- Bookmark
- Subscribe
- Mute
- Subscribe to RSS Feed
- Permalink
- Notify Moderator
Nov 27, 2013
05:32 PM
Ahhh ok!!!!
Right I have made some progress but I have ran into a problem, I do not know how to find the local maxima of the graph! I can see it of course, have I just to trace the point and state it or is there a method of finding it?
Trying to post my worksheet I cant remeber how to haha
Nov 27, 2013
06:25 PM
- Mark as New
- Bookmark
- Subscribe
- Mute
- Subscribe to RSS Feed
- Permalink
- Notify Moderator
Nov 27, 2013
06:25 PM
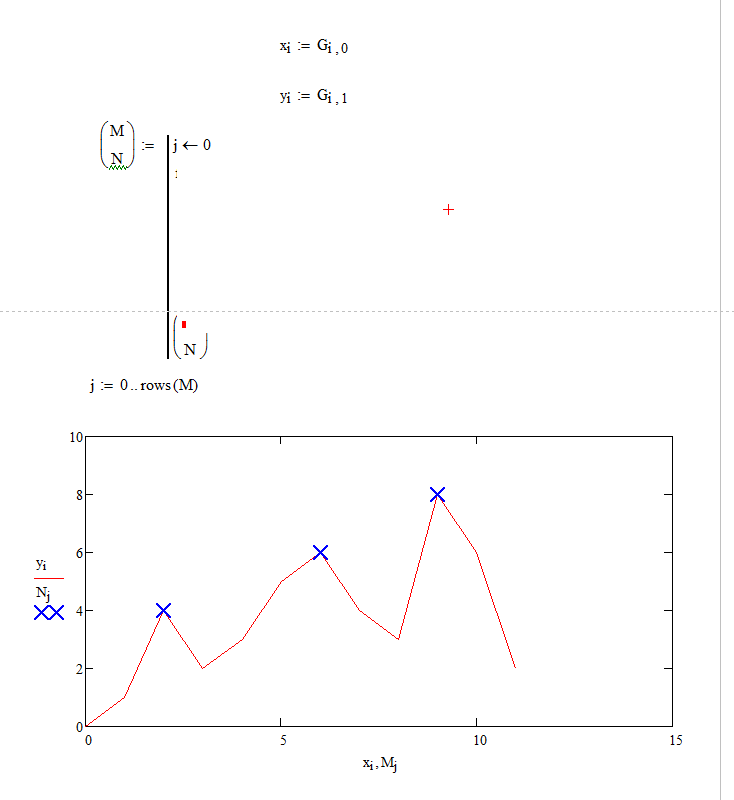
I guess you are supposed to write a program to find the local maximas, not to visually spot and mark them.
You would run through all the points using a for-loop and if you find a point which is higher than its two neighbours you store this value and its corresponding x-value in a matrix which is returned at the end of the program.
You should have learned about programming, loops and if-conditions to do so.
Dealing with the special case like endpoints and consecutive equal data would be the next step, if necessary.
BTW, the plotting of the sample data can be done a bit less cumbersome using your matrix G directly and plotting the second column over the first:
Nov 27, 2013
05:36 PM
- Mark as New
- Bookmark
- Subscribe
- Mute
- Subscribe to RSS Feed
- Permalink
- Notify Moderator
Nov 28, 2013
01:46 PM
- Mark as New
- Bookmark
- Subscribe
- Mute
- Subscribe to RSS Feed
- Permalink
- Notify Moderator
Nov 28, 2013
01:46 PM
I havent had loops or anjything mentioned before just smoothing and the input of data etc.
I have no idea how to even begin to do that function?
thanks:)
Nov 28, 2013
08:48 PM
- Mark as New
- Bookmark
- Subscribe
- Mute
- Subscribe to RSS Feed
- Permalink
- Notify Moderator
Nov 28, 2013
08:48 PM
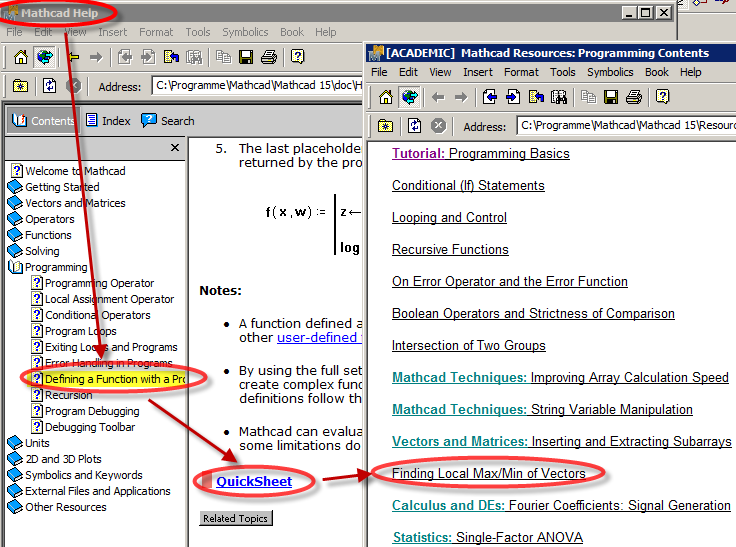
So I would suggest you fire up Mahcad help and begin to read. Especially the chapters on loops, conditions and defiing a functions with a program Don't forget to look at the quicksheets referenced. Rumour has it that you will experience a pleaseant surprise if you do 😉
Dec 04, 2013
10:02 AM
- Mark as New
- Bookmark
- Subscribe
- Mute
- Subscribe to RSS Feed
- Permalink
- Notify Moderator
Dec 04, 2013
10:02 AM
ok I have spend days now reading and cant get a solution, the mathcad help sheets are very vague! Could someone walk me through the process of writing a prgram and explain in a little detail how it pertains to my problem?
thanks in advanced
Dec 04, 2013
11:19 AM
- Mark as New
- Bookmark
- Subscribe
- Mute
- Subscribe to RSS Feed
- Permalink
- Notify Moderator
Dec 04, 2013
11:19 AM
Alison McMillan wrote:
ok I have spend days now reading and cant get a solution, the mathcad help sheets are very vague!
Really?! Thats surprising given that the very exact routine you are supposed to write yourself in that assignment can be found in the help.
Dec 04, 2013
11:25 AM
- Mark as New
- Bookmark
- Subscribe
- Mute
- Subscribe to RSS Feed
- Permalink
- Notify Moderator
Dec 04, 2013
11:25 AM
ok here is what I have, the lecturer assures me this is the way I have to do it!
Dec 04, 2013
11:26 AM
- Mark as New
- Bookmark
- Subscribe
- Mute
- Subscribe to RSS Feed
- Permalink
- Notify Moderator
Dec 04, 2013
11:26 AM
So its not what is in the mathcad help it is completely different! all I have to do is define this program and I can find the maxima but I dont know how as we have not been taugh how
Dec 04, 2013
11:55 AM
- Mark as New
- Bookmark
- Subscribe
- Mute
- Subscribe to RSS Feed
- Permalink
- Notify Moderator
Dec 04, 2013
11:55 AM
Hi,
Looks like you are nearly there.
Have a look at the programming toolbar at the top.

It will give you access to all the functions that you need.
There are many ways to achieve what you want but I guess the object of the excercise is to allow you to explore the options.
Regards
Andy
Dec 04, 2013
02:20 PM
- Mark as New
- Bookmark
- Subscribe
- Mute
- Subscribe to RSS Feed
- Permalink
- Notify Moderator
Dec 04, 2013
02:20 PM
Looks like you are nearly there.
Obviously not.
Alison is argumenting that she never was tought anything about loops, conditions and how to program at all and so it seems to me she thinks she is supposed to solve the assessment without programming at all.
I also guess like you that she is supposed to explore programming on her own and experiment with the possibilities to finally come up with something like the attached (vital part is locked for the same reason you didn't disclose your procedure). I thought that Mathcads built-in help would be a good starting point but it seems it wasn't. Unfortunately I am not aware of a suitable basic tutorial on programming in English to help out.
Not sure if something like
http://archives.math.utk.edu/ICTCM/VOL16/C029/paper.pdf
or installing the E-Book "Inside Mathcad: Programming"
http://communities.ptc.com/community/mathcad/blog/2010/05/13/inside-mathcad-series-programming-solving-and-ode-solvers
would help.
Dec 04, 2013
12:19 PM
- Mark as New
- Bookmark
- Subscribe
- Mute
- Subscribe to RSS Feed
- Permalink
- Notify Moderator
Dec 04, 2013
12:19 PM
So you found the routine shown below and it wasn't helpful?
As you write that you didn't ever learned something about programming in Mathcad I have no clue how you are supposed to solve that assignment.
Dec 05, 2013
09:39 AM
- Mark as New
- Bookmark
- Subscribe
- Mute
- Subscribe to RSS Feed
- Permalink
- Notify Moderator
Dec 05, 2013
09:39 AM
Ok I figured it out! How to get the maxima!
I used a for-loop function but I had to fiddle about with it for a good while!
Dec 05, 2013
11:10 AM
- Mark as New
- Bookmark
- Subscribe
- Mute
- Subscribe to RSS Feed
- Permalink
- Notify Moderator
Dec 05, 2013
11:10 AM
Thats is, yes!! And I guess you were supposed to fiddle around for a while.
In case you wonder why the routine in the help is much longer - this is because the first and the last data point is also considered. In your routine the two end points never will end up as relative maximum. It may be a matter of definition, but if the first point has a larger y-value than the second, it can be considered a local max as ther is no data in the surrounding which is higher. This would be the case in your sample data if the firest y-value would be changed to 2.
My approach is a bit more tricky (the password for the protected regions is "euler" without the quotes) as I used two auxiliary routines left() and right(). left() will go to the left of the current data and will stop if it arrives either at a data point with a differént y-value than the current or at the end at index 0 and returns that value which is then compared the similar way as you did with X[j-1,1. That way I can run through the data including the endpoints from 0 to rows()-1 and because I used <= instead of just < the routine acounts automatically for the endpoints and for consecutive data of equal values. But it may be a bit to tricky for this assignment.

