
Turn on suggestions
Auto-suggest helps you quickly narrow down your search results by suggesting possible matches as you type.
Showing results for
Turn on suggestions
Auto-suggest helps you quickly narrow down your search results by suggesting possible matches as you type.
Showing results for
Community Tip - Did you get called away in the middle of writing a post? Don't worry you can find your unfinished post later in the Drafts section of your profile page. X
Options
- Subscribe to RSS Feed
- Mark Topic as New
- Mark Topic as Read
- Float this Topic for Current User
- Bookmark
- Subscribe
- Mute
- Printer Friendly Page
Weird reverse
Aug 27, 2014
05:43 AM
- Mark as New
- Bookmark
- Subscribe
- Mute
- Subscribe to RSS Feed
- Permalink
- Notify Moderator
Aug 27, 2014
05:43 AM
Weird reverse
Hello folks,
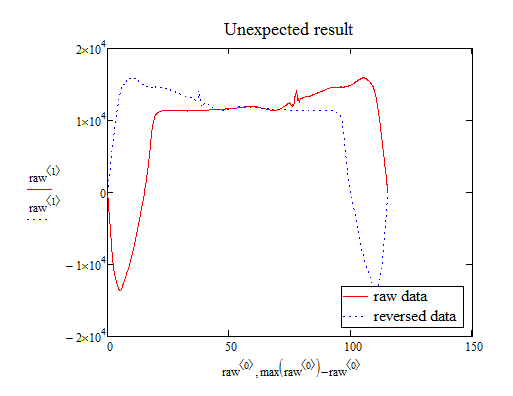
I do still have an unexpected result from the reverse function although it works as expected in some instances; see attached sheet.
When creating an array and reversing the order of the second column then one sees in the graph the reversed function. I.e. last values being depicted first.
However, when I do the same on some measurement data, all I get is the weird looking curve in the left graph.
Does anybody have an explanation? Mike perhaps?
Raiko
Solved! Go to Solution.
Labels:
- Labels:
-
Statistics_Analysis
1 ACCEPTED SOLUTION
Accepted Solutions
Aug 27, 2014
06:34 AM
- Mark as New
- Bookmark
- Subscribe
- Mute
- Subscribe to RSS Feed
- Permalink
- Notify Moderator
Aug 27, 2014
06:34 AM
Mike Armstrong wrote:
Well put Werner, better explanation than I managed
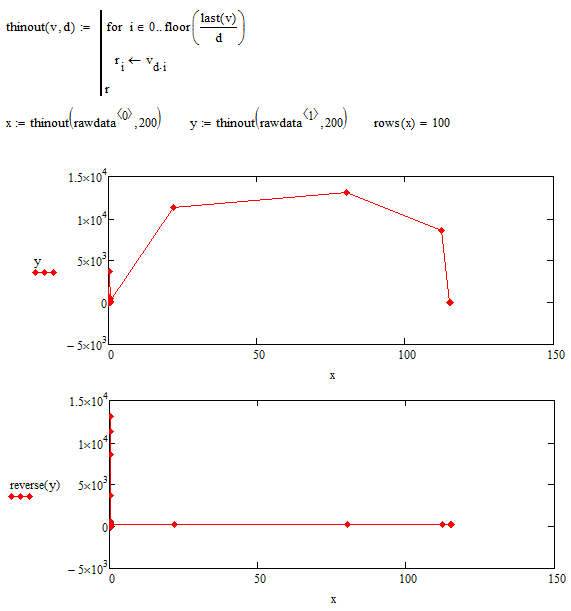
We can see the effect better if we thin out the data to, lets say just 100 data points.
11 REPLIES 11
Aug 27, 2014
05:54 AM
- Mark as New
- Bookmark
- Subscribe
- Mute
- Subscribe to RSS Feed
- Permalink
- Notify Moderator
Aug 27, 2014
05:54 AM
It seems to me that your graphs are plotting from right to left?
When you reverse the data the extreme values of rawdata<1> correspond to smaller values of rawdata<0>. To me the results are what I would expect.
Aug 27, 2014
06:10 AM
- Mark as New
- Bookmark
- Subscribe
- Mute
- Subscribe to RSS Feed
- Permalink
- Notify Moderator
Aug 27, 2014
06:10 AM
Sorry Mike, I mixed up the zip files. Here we go with a new one.
What I don't understand is why the graph of the reversed measurement points is not the mirror image of the raw data as shown in the right hand graph.
Raiko
Aug 27, 2014
06:43 AM
- Mark as New
- Bookmark
- Subscribe
- Mute
- Subscribe to RSS Feed
- Permalink
- Notify Moderator
Aug 27, 2014
06:43 AM
Raiko,
I also expected a mirrored graph at first until I realized that this woul only happen if the abscissa values are equally spaced as they are in your test plot to the right.
But they aren't in your measurement data.
Here is a plot with your data thinned out to 100 points only. You can clearly see that we have just about half a dozen higher ordinate values. These are stretched out to the right in the nonreversed plot but crashed together to the left in the reversed one.
To get a mirrored plot you can either manually reverse the limits on the abscissa axis as Mike had done or you create a new vector for the absicissa with 150-data<0> where 150 is the maximum of data<0>.
Embedding pictures does not fork for me at the moment (this happens ever so often here) so I attach them.
Aug 27, 2014
05:59 AM
- Mark as New
- Bookmark
- Subscribe
- Mute
- Subscribe to RSS Feed
- Permalink
- Notify Moderator
Aug 27, 2014
05:59 AM
Are you looking for something like this?
Aug 27, 2014
06:14 AM
- Mark as New
- Bookmark
- Subscribe
- Mute
- Subscribe to RSS Feed
- Permalink
- Notify Moderator
Aug 27, 2014
06:14 AM
Mike,
you don't change anything if you reverse both vectors.
You have changed the limits on the absicissa manually and if you do that in the original plot you get the same efect 😉
Aug 27, 2014
06:19 AM
- Mark as New
- Bookmark
- Subscribe
- Mute
- Subscribe to RSS Feed
- Permalink
- Notify Moderator
Aug 27, 2014
06:19 AM
Werner Exinger wrote:
Mike,
you don't change anything if you reverse both vectors.
You have changed the limits on the absicissa manually and if you do that in the original plot you get the same efect 😉
Oops yes. The graphs are working correctly IMO.
Aug 27, 2014
06:13 AM
- Mark as New
- Bookmark
- Subscribe
- Mute
- Subscribe to RSS Feed
- Permalink
- Notify Moderator
Aug 27, 2014
06:13 AM
I agree with Mike - its all OK.
The puzzling effect occurs because the values on the abscissa are not equally spaced.
If you reverse one of the columns, the higher ordinate values get related to very narrow spaced abscissa values which looks like a spike.
Aug 27, 2014
06:22 AM
- Mark as New
- Bookmark
- Subscribe
- Mute
- Subscribe to RSS Feed
- Permalink
- Notify Moderator
Aug 27, 2014
06:22 AM
Well put Werner, better explanation than I managed 
Aug 27, 2014
06:34 AM
- Mark as New
- Bookmark
- Subscribe
- Mute
- Subscribe to RSS Feed
- Permalink
- Notify Moderator
Aug 27, 2014
06:34 AM
Mike Armstrong wrote:
Well put Werner, better explanation than I managed
We can see the effect better if we thin out the data to, lets say just 100 data points.
Aug 27, 2014
07:21 AM
- Mark as New
- Bookmark
- Subscribe
- Mute
- Subscribe to RSS Feed
- Permalink
- Notify Moderator
Aug 27, 2014
07:21 AM
Mike, Werner
thank you very much for your effort. It is really in the data (no pun intended)
Raiko
Aug 27, 2014
09:06 AM
- Mark as New
- Bookmark
- Subscribe
- Mute
- Subscribe to RSS Feed
- Permalink
- Notify Moderator
Aug 27, 2014
09:06 AM
RaikoRaiko Milanovic wrote:
Mike, Werner
thank you very much for your effort. It is really in the data (no pun intended)
Raiko
Hahahahah 

