
Turn on suggestions
Auto-suggest helps you quickly narrow down your search results by suggesting possible matches as you type.
Showing results for
Turn on suggestions
Auto-suggest helps you quickly narrow down your search results by suggesting possible matches as you type.
Showing results for
Community Tip - Want the oppurtunity to discuss enhancements to PTC products? Join a working group! X
Options
- Subscribe to RSS Feed
- Mark Topic as New
- Mark Topic as Read
- Float this Topic for Current User
- Bookmark
- Subscribe
- Mute
- Printer Friendly Page
When does a vector stop being a vector?
Jun 25, 2015
08:47 AM
- Mark as New
- Bookmark
- Subscribe
- Mute
- Subscribe to RSS Feed
- Permalink
- Notify Moderator
Jun 25, 2015
08:47 AM
When does a vector stop being a vector?
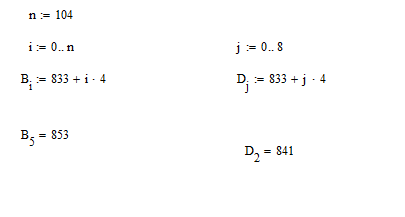
I'm a MathCAD new user and am confused by what I'm seeing. In the attached example, I've created a range variable and used it in a calculation. The result, B, is shown and is apparently NOT a vector.
To the right, I've done the same thing except that the range variable on goes from 0 to 8. In this case the result, D, IS a vector. If I change the value of j to 9, the result changes in appearance and is no longer a vector.
I don't understand what's going on here which is, naturally, impairing my ability to solve a real problem. I seem to be confused as to what constitutes a vector.
Solved! Go to Solution.
1 ACCEPTED SOLUTION
Accepted Solutions
Jun 25, 2015
10:54 AM
- Mark as New
- Bookmark
- Subscribe
- Mute
- Subscribe to RSS Feed
- Permalink
- Notify Moderator
Jun 25, 2015
10:54 AM
Both, B and D, are proper vectors.
What confuses you is the optical representation.
Every vector can be shown in one of two ways - matrix style (like your D) or table style (like your B).
By default Mathcad uses automatic display, which means that vectors up to 9 elements are shown in matrix display and vectors with more elements are shown table style (so you can size the region and be able to scroll).
Double click the RHS of B= (or use Format Result), activate tab "Display Options" and change "Matrix Display Style" from "Automatic" to "Matrix" to get the view you were expecting. You will see immediately, why Mathcad had chosen Matrix style, as a vector with 105 elements is not that easy to handle when showing all elements in one view.
In table view you can resize, the region, right click and chose properties to change the font size and decide, whether you want row and column headers or not.
LT
8 REPLIES 8
Jun 25, 2015
10:32 AM
- Mark as New
- Bookmark
- Subscribe
- Mute
- Subscribe to RSS Feed
- Permalink
- Notify Moderator
Jun 25, 2015
10:32 AM
What version of Mathcad are you using because both A and B are vectors when I open the worksheet.
Jun 25, 2015
10:34 AM
- Mark as New
- Bookmark
- Subscribe
- Mute
- Subscribe to RSS Feed
- Permalink
- Notify Moderator
Jun 25, 2015
10:34 AM
If you are struggling with the differences between ranges, range variables and vectors have a look here.
Jun 25, 2015
11:17 AM
- Mark as New
- Bookmark
- Subscribe
- Mute
- Subscribe to RSS Feed
- Permalink
- Notify Moderator
Jun 25, 2015
11:17 AM
Thanks! My n00b problem is indeed understanding how to use these concepts.
Jun 25, 2015
10:54 AM
- Mark as New
- Bookmark
- Subscribe
- Mute
- Subscribe to RSS Feed
- Permalink
- Notify Moderator
Jun 25, 2015
10:54 AM
Both, B and D, are proper vectors.
What confuses you is the optical representation.
Every vector can be shown in one of two ways - matrix style (like your D) or table style (like your B).
By default Mathcad uses automatic display, which means that vectors up to 9 elements are shown in matrix display and vectors with more elements are shown table style (so you can size the region and be able to scroll).
Double click the RHS of B= (or use Format Result), activate tab "Display Options" and change "Matrix Display Style" from "Automatic" to "Matrix" to get the view you were expecting. You will see immediately, why Mathcad had chosen Matrix style, as a vector with 105 elements is not that easy to handle when showing all elements in one view.
In table view you can resize, the region, right click and chose properties to change the font size and decide, whether you want row and column headers or not.
LT
Jun 25, 2015
11:04 AM
- Mark as New
- Bookmark
- Subscribe
- Mute
- Subscribe to RSS Feed
- Permalink
- Notify Moderator
Jun 25, 2015
11:04 AM
I think , from what you have said that the issue is how the data is displayed.
As has been said , both are vectors , its just that one is displayed as a vector (matrix) and the other as table.
Mathcad automatically chooses the format that it uses to display, but if you want to select a format:
First select the area you want to modify, then (when highlighted) click the format option on the top menu-bar and then result. This will bring up a pop-up box, pick the Display options tab and there you will find the "Matrix display style" - it defaults to Automatic , but you can force it to Table or Matrix.
Unfortunately, You do have to repeat this for each existing instance.
If you copy & paste a region it should 'remember' the setting.
Regards
Andy
Jun 25, 2015
11:43 AM
- Mark as New
- Bookmark
- Subscribe
- Mute
- Subscribe to RSS Feed
- Permalink
- Notify Moderator
Jun 25, 2015
11:43 AM
A Westerman wrote:
....This will bring up a pop-up box, pick the Display options tab and there you will find the "Matrix display style" - it defaults to Automatic , but you can force it to Table or Matrix.Unfortunately, You do have to repeat this for each existing instance.
If you copy & paste a region it should 'remember' the setting.
Not quite true. It is if you want to vary every instance, but if you want to change it globally, then all you have to do is click in a blank area of the worksheet and change the format (including any other display options) to how you want it. I've got my Normal template set to Matrix and Expand Nested, plus General format Exponential Threshold = 7, as these values suit my needs better overall.
Stuart
Jun 25, 2015
11:15 AM
- Mark as New
- Bookmark
- Subscribe
- Mute
- Subscribe to RSS Feed
- Permalink
- Notify Moderator
Jun 25, 2015
11:15 AM
Greg Westbrook wrote:
I'm a MathCAD new user and am confused by what I'm seeing. In the attached example, I've created a range variable and used it in a calculation. The result, B, is shown and is apparently NOT a vector.
To the right, I've done the same thing except that the range variable on goes from 0 to 8. In this case the result, D, IS a vector. If I change the value of j to 9, the result changes in appearance and is no longer a vector.
I don't understand what's going on here which is, naturally, impairing my ability to solve a real problem. I seem to be confused as to what constitutes a vector.
B hasn't stopped being a vector, it's just that way Mathcad displays is has changed because of the size of B. If an array has 10 or more rows or columns then, by default, Mathcad displays an array in "Table" form (which you see for B) rather than "Matrix" form (which you see for D). It does this so as not to consume vast amounts of display with large arrays that stretch over several pages.
However, you can see more elements of the array by one of two means.
The first (or rather, first two) use the Table format. If you click on the result of displaying B, you should see a slider bar. Simply drag the slider bar up or down to see the values of interest to you. Alternatively, you can see more elements by clicking on the black markers at the top or bottom of the display and dragging them up or down; this will expand the Table.
The second (or should it now be third) method is to change to Matrix format. Double-click on the result (or choose Format/Result from the Main Menu) and then click on the Display Options tab in the resulting dialog box. In the Matrix Display Style dropdown, choose Matrix. If you do want to display large vectors in Matrix format, it's often better to show the transpose as taking up horizontal space is usually less of an issue than using vertical space!

Stuart
Jun 25, 2015
11:19 AM
- Mark as New
- Bookmark
- Subscribe
- Mute
- Subscribe to RSS Feed
- Permalink
- Notify Moderator
Jun 25, 2015
11:19 AM
Thanks all.
I understand what's going on with the display of vectors. Now on to my real problems. But that should be another discussion.

