
Turn on suggestions
Auto-suggest helps you quickly narrow down your search results by suggesting possible matches as you type.
Showing results for
Turn on suggestions
Auto-suggest helps you quickly narrow down your search results by suggesting possible matches as you type.
Showing results for
Community Tip - You can Bookmark boards, posts or articles that you'd like to access again easily! X
Options
- Subscribe to RSS Feed
- Mark Topic as New
- Mark Topic as Read
- Float this Topic for Current User
- Bookmark
- Subscribe
- Mute
- Printer Friendly Page
Why these two plots are different?
Feb 19, 2014
09:06 AM
- Mark as New
- Bookmark
- Subscribe
- Mute
- Subscribe to RSS Feed
- Permalink
- Notify Moderator
Feb 19, 2014
09:06 AM
Why these two plots are different?
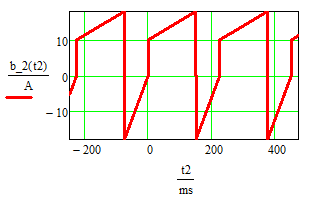
I want to get the period waveform b(t) but when i plot it i find that the plot has a lot of spikes.
the x definition domain is[ 0, f^-1 ) of original function y(t).
Please see the detailed attachment in MathCad15 F000.
Thanks~
Solved! Go to Solution.
1 ACCEPTED SOLUTION
Accepted Solutions
Feb 19, 2014
05:16 PM
- Mark as New
- Bookmark
- Subscribe
- Mute
- Subscribe to RSS Feed
- Permalink
- Notify Moderator
Feb 19, 2014
05:16 PM
In the definition of y(t), on te first line change t greater than or equal to 0 to t greater than 0.
No, this would result in spikes down to zero for most integer multiples of f^-1. (e.g. b(8*f^-1)=0! The problem with b(10*f^-1) is due to numeric inaccuracies combined with the way Pirates tried to make his function periodic using that sum. Basically he is summing up y(10*f^-1 - n*f^-1) and all n but n=10 (yields 13A) should yield 0. Because of numerical inaccuracies 10*f^-1 - 9*f^-1 does not evaluate to f^-1 but to a value very slightly smaller and so y(of this value) is not zero but close to 13. See attached file.

Thats nice! And in case Pirates really need it more generic as his variables y1..y4 and D suggest, attached is a sheet which shows some ways to make any function defined in [0; f^-1) a periodic one.
10 REPLIES 10
Feb 19, 2014
01:46 PM
- Mark as New
- Bookmark
- Subscribe
- Mute
- Subscribe to RSS Feed
- Permalink
- Notify Moderator
Feb 19, 2014
01:46 PM
The plots look different because you used Mathcads quickplot feature with different x-ranges. Mathcad will plot using a fix number of points for the whole range, no mattter how long that range may be. That means that for your plot 3 less points are used for the visibile part of your curve and obviously the x-value which results in that spike is not amongst the plotted values in your plot 3.
You have more control if you use a range variable for x, lets say x:=9*f^-1,9*f^-1+2*f^-1/100 .. 11*f^-1. Play around with the number I set to 100, it gives you the numer of point used for the plot.
What is the reason for the definition of your function b(x)? If you just tried to make your function periodic, there are more efficient ways to do.
Feb 20, 2014
06:09 AM
- Mark as New
- Bookmark
- Subscribe
- Mute
- Subscribe to RSS Feed
- Permalink
- Notify Moderator
Feb 20, 2014
06:09 AM
Thank you for your answers.
After I read all the posts,I think I kown why the plot has spikes.
What is the reason for the definition of your function b(x)? If you just tried to make your function periodic, there are more efficient ways to do.
You are right.I just want to get a periodic function to show a real current waveform in panorama, althought the RMS and AVG value can be calculated from y(t) which is a non-periodic function. Your ways to make periodic function are nice. Thank you.
Feb 20, 2014
06:53 AM
- Mark as New
- Bookmark
- Subscribe
- Mute
- Subscribe to RSS Feed
- Permalink
- Notify Moderator
Feb 20, 2014
06:53 AM
Werner Exinger 编写:
The plots look different because you used Mathcads quickplot feature with different x-ranges. Mathcad will plot using a fix number of points for the whole range, no mattter how long that range may be...
What is the number in "fix number of points" when Mathcads do quickplot? 
Feb 19, 2014
02:55 PM
- Mark as New
- Bookmark
- Subscribe
- Mute
- Subscribe to RSS Feed
- Permalink
- Notify Moderator
Feb 19, 2014
02:55 PM
In the definition of y(t), on te first line change t greater than or equal to 0 to t greater than 0.
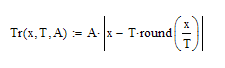
This function will generate a traingle wave of period T and amplitude A:
Feb 19, 2014
05:16 PM
- Mark as New
- Bookmark
- Subscribe
- Mute
- Subscribe to RSS Feed
- Permalink
- Notify Moderator
Feb 19, 2014
05:16 PM
In the definition of y(t), on te first line change t greater than or equal to 0 to t greater than 0.
No, this would result in spikes down to zero for most integer multiples of f^-1. (e.g. b(8*f^-1)=0! The problem with b(10*f^-1) is due to numeric inaccuracies combined with the way Pirates tried to make his function periodic using that sum. Basically he is summing up y(10*f^-1 - n*f^-1) and all n but n=10 (yields 13A) should yield 0. Because of numerical inaccuracies 10*f^-1 - 9*f^-1 does not evaluate to f^-1 but to a value very slightly smaller and so y(of this value) is not zero but close to 13. See attached file.
Thats nice! And in case Pirates really need it more generic as his variables y1..y4 and D suggest, attached is a sheet which shows some ways to make any function defined in [0; f^-1) a periodic one.
Feb 19, 2014
05:27 PM
- Mark as New
- Bookmark
- Subscribe
- Mute
- Subscribe to RSS Feed
- Permalink
- Notify Moderator
Feb 19, 2014
05:27 PM
In the definition of y(t), on te first line change t greater than or equal to 0 to t greater than 0.
No, this would result in spikes down to zero for most integer multiples of f^-1. (e.g. b(8*f^-1)=0!
Yes, you are right. It works forthe plots he has, but it wil not always work.
Thats nice!
I wish I could claim I thought of it, but it's from Tom Gutman 
attached is a sheet which shows some ways to make any function defined in [0; f^-1) a periodic one.
That's very useful. I just added that to my collection. 
Feb 20, 2014
06:47 AM
- Mark as New
- Bookmark
- Subscribe
- Mute
- Subscribe to RSS Feed
- Permalink
- Notify Moderator
Feb 20, 2014
06:47 AM
I learned some useful way to make periodic function. Most important is that, now I kown a function's independent variable can be general variable but also a function,.Like RMS(fun,f),its independent variables are f and a function func(t)
Thats nice! And in case Pirates really need it more generic as his variables y1..y4 and D suggest, attached is a sheet which shows some ways to make any function defined in [0; f^-1) a periodic one.
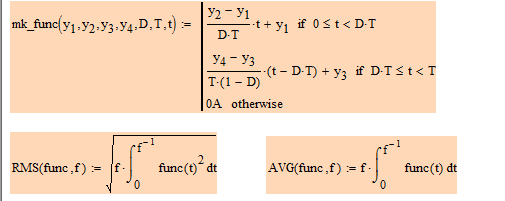
Method2 does not work well if the x rang is 0 to 10T, b(9T) has spike to 0.I did as you debug in page one of the sheet, but I can't find why this occurs. Is is another reason,because method2's b(t) is different from my sheet's b(t),and method2's b(t) calculate t-T*floor(t/T) firstly, so when t= 9T, then t←0
,then it is the same as b(0s) and should be equal to y1= 13A.
Feb 20, 2014
11:04 AM
- Mark as New
- Bookmark
- Subscribe
- Mute
- Subscribe to RSS Feed
- Permalink
- Notify Moderator
Feb 20, 2014
11:04 AM
Method2 does not work well if the x rang is 0 to 10T, b(9T) has spike to 0
It looks like this time its not exactly for t=9T as b(9T) is correctly calculated with 13A. But I was not able to find any value for t near 9T with b(t) <13A. ! The result 0 would only be possible if t-T*trunc(t/T) yields a result outside the range [0; T). I could image that numerical inaccuracies could be responsible for that, too. E.g. could 9*T/T give something minimal smaller than 9 and so t-floor(t/T) would give 8 instead of 9 and t will get the value of T instead of 0. But b(T)=0. But i was not able to find such a value and changíng t<T in the definition of b() tp b<=T didn't cure it either. So it may be something else.
Anyway, you can get rid of this begaviour if you don't use the quickplot feature and provide a range variable for t or if you you method1 - the "double mod method", but with the fixed sign as described in another post here.
Feb 20, 2014
09:12 AM
- Mark as New
- Bookmark
- Subscribe
- Mute
- Subscribe to RSS Feed
- Permalink
- Notify Moderator
Feb 20, 2014
09:12 AM
Thank you all.
but mk_periodic1(func,T,t) is not the same as mk_periodic2(func,T,t) if D≠0.5,Their monotone increasing duties are D for mk_periodic1 and (1-D) for mk_periodic2. mk_periodic4(func,T,t) has the same plot with mk_periodic2(func,T,t)
My last reply is waiting for the approval of the community moderators, but it was about 2hrs ago...
The attachment is the sheet i have amended.
Feb 20, 2014
10:21 AM
- Mark as New
- Bookmark
- Subscribe
- Mute
- Subscribe to RSS Feed
- Permalink
- Notify Moderator
Feb 20, 2014
10:21 AM
You are right - there was a typo in mk_periodic1 the minus should be a plus - sorry!

Your way of curing it doesn't work for negative values of t and for positive values you wont need a second mod() at all. The second mod is necessary because Mathcad yields negative results for negative t values. So in Mathcad you get mod(-7,5)=-2 instead of +3. So T has to be added(!) to the result of the first mod(), but if t was positive the new value (sum) is too large and so I added the second mod() to take care of it without changing the correct value we already got for neagive t. We could do soemthing similar with if(), but I guess the double mod() is faster (not sure about that, though).
Find attached the fixed worksheets.

