
Turn on suggestions
Auto-suggest helps you quickly narrow down your search results by suggesting possible matches as you type.
Showing results for
Turn on suggestions
Auto-suggest helps you quickly narrow down your search results by suggesting possible matches as you type.
Showing results for
Community Tip - You can subscribe to a forum, label or individual post and receive email notifications when someone posts a new topic or reply. Learn more! X
Options
- Subscribe to RSS Feed
- Mark Topic as New
- Mark Topic as Read
- Float this Topic for Current User
- Bookmark
- Subscribe
- Mute
- Printer Friendly Page
X Y plots on MathCAD 15.0
Feb 05, 2014
01:01 PM
- Mark as New
- Bookmark
- Subscribe
- Mute
- Subscribe to RSS Feed
- Permalink
- Notify Moderator
Feb 05, 2014
01:01 PM
X Y plots on MathCAD 15.0
Hi,
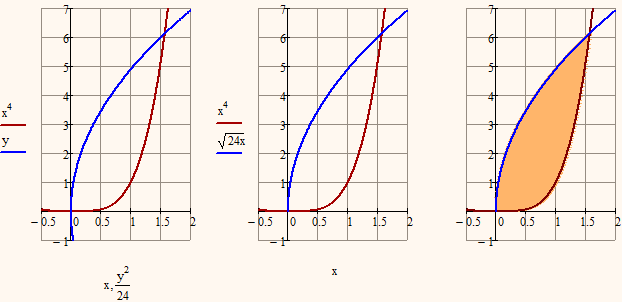
Can someone explain how to plot the graphs of
y=x^4
and y^2= 24x
on the same plot to enable me to work out the enclosed area between the two curves.
Thanks in advance
Matt
Solved! Go to Solution.
Labels:
- Labels:
-
Other
1 ACCEPTED SOLUTION
Accepted Solutions
Feb 07, 2014
12:20 PM
- Mark as New
- Bookmark
- Subscribe
- Mute
- Subscribe to RSS Feed
- Permalink
- Notify Moderator
Feb 07, 2014
12:20 PM
A variable which has been assigned a value can't be used for a quickplot.
See the attached file for some solutions.
16 REPLIES 16
Feb 05, 2014
01:02 PM
- Mark as New
- Bookmark
- Subscribe
- Mute
- Subscribe to RSS Feed
- Permalink
- Notify Moderator
Feb 05, 2014
01:02 PM
If noone guessed I'm using MathCAD 15.0 programme
Feb 05, 2014
01:35 PM
- Mark as New
- Bookmark
- Subscribe
- Mute
- Subscribe to RSS Feed
- Permalink
- Notify Moderator
Feb 05, 2014
01:35 PM
Not sure we could have guessed from your original post 
Mike
Feb 05, 2014
01:36 PM
- Mark as New
- Bookmark
- Subscribe
- Mute
- Subscribe to RSS Feed
- Permalink
- Notify Moderator
Feb 05, 2014
02:41 PM
- Mark as New
- Bookmark
- Subscribe
- Mute
- Subscribe to RSS Feed
- Permalink
- Notify Moderator
Feb 05, 2014
02:41 PM
How do you get that but I get this?!
I'm obviously missing something here!!
And I need the second equation to be y(sqrd)
y^2 = 24x
Feb 05, 2014
03:11 PM
- Mark as New
- Bookmark
- Subscribe
- Mute
- Subscribe to RSS Feed
- Permalink
- Notify Moderator
Feb 05, 2014
03:11 PM
Have a look at the attached.
It seems you put a decimal after the y2 definition. Make sure you start the brackets immediately after the variable.
Feb 05, 2014
03:15 PM
- Mark as New
- Bookmark
- Subscribe
- Mute
- Subscribe to RSS Feed
- Permalink
- Notify Moderator
Feb 05, 2014
03:15 PM
Something like the attached, guess.
Unfortunately Mathcad still does not plot implicit functions, so you have to reformulate it either explicit to x or to y.
@Mike: I think you misinterpreted the second function
Feb 05, 2014
03:21 PM
- Mark as New
- Bookmark
- Subscribe
- Mute
- Subscribe to RSS Feed
- Permalink
- Notify Moderator
Feb 05, 2014
03:21 PM
Good point Werner,
I didn't want to change the formula as I wanted to show him how to graph it. Superb work by the way.
Feb 05, 2014
04:13 PM
- Mark as New
- Bookmark
- Subscribe
- Mute
- Subscribe to RSS Feed
- Permalink
- Notify Moderator
Feb 05, 2014
04:13 PM
Werner,
I have just been working on your sheet as one of my weak points with Mathcad is the symbolic solvers.
Did you use the first row of numbers in the matrix because they relate to the x-axis?
Feb 05, 2014
04:39 PM
- Mark as New
- Bookmark
- Subscribe
- Mute
- Subscribe to RSS Feed
- Permalink
- Notify Moderator
Feb 05, 2014
04:39 PM
as one of my weak points with Mathcad is the symbolic solvers.
Maybe because the symbolic solver is one of the weak points of Mathcad 😉
Did you use the first row of numbers in the matrix because they relate to the x-axis?
No and yes 😉
No, I used the first colum (for the integration interval) and
yes, I did that because the first column represents the abscissa values.
solve results one solution per row, wheras Find one solution per column.
I have not yet found a way to limit the results of the symbolic evaluated Find() to the two real ones.
Feb 05, 2014
04:46 PM
- Mark as New
- Bookmark
- Subscribe
- Mute
- Subscribe to RSS Feed
- Permalink
- Notify Moderator
Feb 05, 2014
04:46 PM
Werner Exinger wrote:
as one of my weak points with Mathcad is the symbolic solvers.
Maybe because the symbolic solver is one of the weak points of Mathcad 😉
Maybe I have been lazy over the years and failed to find a requirement for it. However, this is a great example and one for collection.
Werner Exinger wrote:
as one of my weak points with Mathcad is the symbolic solvers.
Maybe because the symbolic solver is one of the weak points of Mathcad 😉
Did you use the first row of numbers in the matrix because they relate to the x-axis?
No and yes 😉
No, I used the first colum (for the integration interval) and
yes, I did that because the first column represents the abscissa values.
Sorry I did mean column.
Cheers for the explanation.
Feb 07, 2014
11:15 AM
- Mark as New
- Bookmark
- Subscribe
- Mute
- Subscribe to RSS Feed
- Permalink
- Notify Moderator
Feb 07, 2014
11:15 AM
Thanks for your help.
I have got down to plotting the graphs but still am not having any luck.
Can anyone help to solve my problem?! I just need those graphs to be plotted on the same axis
Cheers
Feb 07, 2014
12:20 PM
- Mark as New
- Bookmark
- Subscribe
- Mute
- Subscribe to RSS Feed
- Permalink
- Notify Moderator
Feb 07, 2014
12:20 PM
A variable which has been assigned a value can't be used for a quickplot.
See the attached file for some solutions.
Feb 07, 2014
07:26 PM
- Mark as New
- Bookmark
- Subscribe
- Mute
- Subscribe to RSS Feed
- Permalink
- Notify Moderator
Feb 07, 2014
07:26 PM
How did you do the shading/hatching of the area between the two curves in your post above?
Feb 07, 2014
08:21 PM
- Mark as New
- Bookmark
- Subscribe
- Mute
- Subscribe to RSS Feed
- Permalink
- Notify Moderator
Feb 07, 2014
08:21 PM
Leopold Turek wrote:
How did you do the shading/hatching of the area between the two curves in your post above?
When you click in the plot you see that I plotted every function twice. The first two plots are formatted as plot type "error" (open the plot format menu and see yourself). Usally this will draw a vertical double-T line between appropriate points and its a quick and dirty way to get some kind of shading. I plotted these first two functions using a range variable, so only the range between the points of intersection is shaded. This range variable is named x. (note the dot after the x - just like you wanted to type and index. This variable looks like a normal x if you dont click on it). Experiment with the range variable, change the 0.01 to 0.1 and you will see the vertical lines. BTW, its important to plot the shading before the actual curves, otherwise the "shading" will cover (at least partially) the curves.
If you search for "hatching" here in the forum you will find other ways of doing it, but all would require more or less complicated user defined functions. The most versatile routine is the one of Prof. Birkeland here http://communities.ptc.com/docs/DOC-3380
Feb 12, 2014
06:58 AM
- Mark as New
- Bookmark
- Subscribe
- Mute
- Subscribe to RSS Feed
- Permalink
- Notify Moderator
Feb 12, 2014
06:58 AM
Here is another thread that might be of interest to you http://communities.ptc.com/message/205924#205924
Feb 12, 2014
11:41 AM
- Mark as New
- Bookmark
- Subscribe
- Mute
- Subscribe to RSS Feed
- Permalink
- Notify Moderator
Feb 12, 2014
11:41 AM
Thank for the link. Truly interesting and valuable information!

