
Turn on suggestions
Auto-suggest helps you quickly narrow down your search results by suggesting possible matches as you type.
Showing results for
Turn on suggestions
Auto-suggest helps you quickly narrow down your search results by suggesting possible matches as you type.
Showing results for
Community Tip - You can subscribe to a forum, label or individual post and receive email notifications when someone posts a new topic or reply. Learn more! X
Options
- Subscribe to RSS Feed
- Mark Topic as New
- Mark Topic as Read
- Float this Topic for Current User
- Bookmark
- Subscribe
- Mute
- Printer Friendly Page
Yield/Failure functions
Jun 01, 2009
09:43 AM
- Mark as New
- Bookmark
- Subscribe
- Mute
- Subscribe to RSS Feed
- Permalink
- Notify Moderator
Jun 01, 2009
09:43 AM
Yield/Failure functions
Hello all, Just wondering if anyone knows how to plot the yield/failure surface of say the Mohr-Coulomb or other failure surface in MathCAD? I have a complex function to define the failure surface though am having a fair bit of difficulty plotting it in MathCAD. Any help woul dbe great!
Labels:
- Labels:
-
Other
17 REPLIES 17
Jun 01, 2009
10:23 AM
- Mark as New
- Bookmark
- Subscribe
- Mute
- Subscribe to RSS Feed
- Permalink
- Notify Moderator
Jun 01, 2009
10:23 AM
If you could post what you've done so far, that would be a help in giving guidance.
Jun 01, 2009
10:30 AM
- Mark as New
- Bookmark
- Subscribe
- Mute
- Subscribe to RSS Feed
- Permalink
- Notify Moderator
Jun 01, 2009
10:30 AM
"Stuart Bruff" wrote:
If you could post what you've done so far, that would be a help in giving guidance.
Jun 01, 2009
10:44 AM
- Mark as New
- Bookmark
- Subscribe
- Mute
- Subscribe to RSS Feed
- Permalink
- Notify Moderator
Jun 01, 2009
10:44 AM
It's a surface, so of course it has to be a function of 2 variables. As Stuart says, without seeing a worksheet it's tough to say much more. Richard
Jun 01, 2009
10:51 AM
- Mark as New
- Bookmark
- Subscribe
- Mute
- Subscribe to RSS Feed
- Permalink
- Notify Moderator
Jun 01, 2009
10:51 AM
"Richard Jackson" wrote:
It's a surface, so of course it has to be a function of 2 variables. As Stuart says, without seeing a worksheet it's tough to say much more. Richard
Jun 01, 2009
05:33 PM
- Mark as New
- Bookmark
- Subscribe
- Mute
- Subscribe to RSS Feed
- Permalink
- Notify Moderator
Jun 01, 2009
05:33 PM
"Anmol Bedi" wrote:
however you would think that there would be a method to plot a surface as a function of three variables on three axes (being the sig1,sig2 & sig3 axis in octahedral stress space).
Jun 02, 2009
05:37 AM
- Mark as New
- Bookmark
- Subscribe
- Mute
- Subscribe to RSS Feed
- Permalink
- Notify Moderator
Jun 02, 2009
05:37 AM
"Anmol Bedi" wrote:
however you would think that there would be a method to plot a surface as a function of three variables on three axes (being the sig1,sig2 & sig3 axis in octahedral stress space).
Jun 02, 2009
07:12 AM
- Mark as New
- Bookmark
- Subscribe
- Mute
- Subscribe to RSS Feed
- Permalink
- Notify Moderator
Jun 02, 2009
07:12 AM
"Stuart Bruff" wrote:
Another way of representing it would be to use colour for the 4th dimension. Needless to say, this kind of thing has been on my request list for some time.
Nov 30, 2011
07:19 AM
- Mark as New
- Bookmark
- Subscribe
- Mute
- Subscribe to RSS Feed
- Permalink
- Notify Moderator
Nov 30, 2011
07:19 AM
Like this?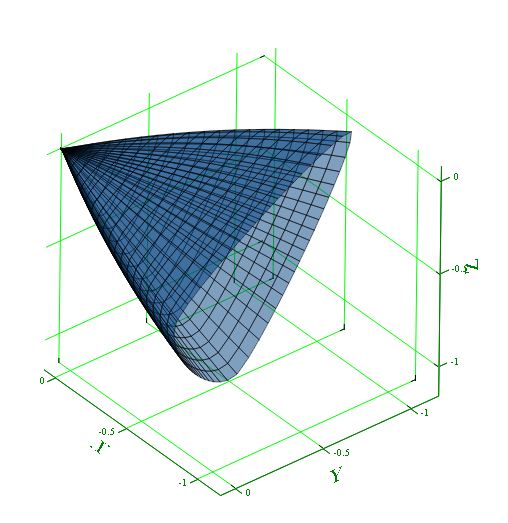
Nov 30, 2011
07:51 AM
- Mark as New
- Bookmark
- Subscribe
- Mute
- Subscribe to RSS Feed
- Permalink
- Notify Moderator
Nov 30, 2011
07:51 AM
Nice example, but this thread is over 2 years old.
Mike
Nov 30, 2011
09:41 AM
- Mark as New
- Bookmark
- Subscribe
- Mute
- Subscribe to RSS Feed
- Permalink
- Notify Moderator
Nov 30, 2011
09:41 AM
Sorry, not looked at the date. But you can always revive this interesting topic.
Nov 30, 2011
09:46 AM
- Mark as New
- Bookmark
- Subscribe
- Mute
- Subscribe to RSS Feed
- Permalink
- Notify Moderator
Nov 30, 2011
09:46 AM
Fully agree. Was just making you aware incase you were waiting on a reply 
The only name I recognise is Richards.
Mike
Jul 11, 2013
12:29 PM
- Mark as New
- Bookmark
- Subscribe
- Mute
- Subscribe to RSS Feed
- Permalink
- Notify Moderator
Jul 11, 2013
12:29 PM
Hi,
I've just re-checked this after a long time, and actually this is exactly what I am after!
Can you please still help with this?
Cheers,
A.
Jul 11, 2013
02:43 PM
- Mark as New
- Bookmark
- Subscribe
- Mute
- Subscribe to RSS Feed
- Permalink
- Notify Moderator
Jul 11, 2013
02:43 PM
Hi.
I'll try.
At first, creates the function for plot surface in cylindrical coordinate system:
R(Z,thetta)
Angel range is -60deg...+60deg
The Z-axes in this function is the resultant of stresses sigm1 and sigm2 (or sigm2 and sigm3, or sigm1 and sigm3 -- it dosn't matter)
Then function R(Z,thetta) reduse to 6 functions in Cartesian coordinate system FX(Z,thetta+A) and FY(Z,thetta+A). The A = -150deg, -30deg and 90deg for every pair of functions (why it's so -- I don't remember).
Then using affine transformation rotate functions FX and FY around Y and Z axes.
Then creates Mesh and Plot ))
Example: https://www.dropbox.com/s/dr3lpscloub7fh0/123456-1.xmcd
Jul 11, 2013
04:22 PM
- Mark as New
- Bookmark
- Subscribe
- Mute
- Subscribe to RSS Feed
- Permalink
- Notify Moderator
Jul 11, 2013
04:22 PM
Example: https://www.dropbox.com/s/dr3lpscloub7fh0/123456-1.xmcd
You can attach files directly here if you chose "Use advanced editor" at the upper right.
Jul 11, 2013
04:53 PM
- Mark as New
- Bookmark
- Subscribe
- Mute
- Subscribe to RSS Feed
- Permalink
- Notify Moderator
Jul 11, 2013
04:53 PM
ok.
Jul 12, 2013
01:53 AM
- Mark as New
- Bookmark
- Subscribe
- Mute
- Subscribe to RSS Feed
- Permalink
- Notify Moderator
Jul 12, 2013
03:51 AM
- Mark as New
- Bookmark
- Subscribe
- Mute
- Subscribe to RSS Feed
- Permalink
- Notify Moderator
Jul 12, 2013
03:51 AM
VladimirN. wrote:
Please see in attachment.
??? Did you post the wrong file?
The file you posted is exactly the same file w/o modifications which already Artyom posted above!

