
Turn on suggestions
Auto-suggest helps you quickly narrow down your search results by suggesting possible matches as you type.
Showing results for
Turn on suggestions
Auto-suggest helps you quickly narrow down your search results by suggesting possible matches as you type.
Showing results for
Community Tip - Visit the PTCooler (the community lounge) to get to know your fellow community members and check out some of Dale's Friday Humor posts! X
Options
- Subscribe to RSS Feed
- Mark Topic as New
- Mark Topic as Read
- Float this Topic for Current User
- Bookmark
- Subscribe
- Mute
- Printer Friendly Page
frequency band averaging (FBA) of an (output) PSD?
Nov 16, 2015
03:49 AM
- Mark as New
- Bookmark
- Subscribe
- Mute
- Subscribe to RSS Feed
- Permalink
- Notify Moderator
Nov 16, 2015
03:49 AM
frequency band averaging (FBA) of an (output) PSD?
To all
Question is not yet related specifically to a Mathcad feature but has anyone ever heard of 'frequency band averaging (FBA) of an (output) PSD'? I have done some searches and came across a couple of papers mentioning it but nothing showing what are the (main) step carry out.
The overall idea (as I understand it) is to compare to PSDs using some kind of averaging method over a given frequency range
Thanks
Regards
JXB
Labels:
- Labels:
-
Other
18 REPLIES 18
Nov 16, 2015
11:45 AM
- Mark as New
- Bookmark
- Subscribe
- Mute
- Subscribe to RSS Feed
- Permalink
- Notify Moderator
Nov 16, 2015
11:45 AM
1.10 and 1.11 (mainly 1.11)
Nov 19, 2015
01:18 PM
- Mark as New
- Bookmark
- Subscribe
- Mute
- Subscribe to RSS Feed
- Permalink
- Notify Moderator
Nov 19, 2015
01:18 PM
thanks for the link
Nov 19, 2015
01:02 PM
- Mark as New
- Bookmark
- Subscribe
- Mute
- Subscribe to RSS Feed
- Permalink
- Notify Moderator
Nov 19, 2015
01:02 PM
Hello JB!
It deals with the average Bandwidth of the Electronic Signal Processing Circuits relative to a position sensing detector.
So you need a DSP, which converts the signal (with integrated ADC), determines the bandwidth, and compute the average in the frequency domain and this can be done via software.
Bye!
Nov 19, 2015
01:18 PM
- Mark as New
- Bookmark
- Subscribe
- Mute
- Subscribe to RSS Feed
- Permalink
- Notify Moderator
Nov 19, 2015
01:18 PM
Thanks for the info. Appreciated
But in simple term. If I have frequency band (df) centered at a freq 'f' and know the (response) values of the signal at each freq. within df, then (if I understand) one could "replace" the response at 'f' by an average value ( sum(values in df)/n ) where n = number of value in band df
Nov 19, 2015
01:24 PM
- Mark as New
- Bookmark
- Subscribe
- Mute
- Subscribe to RSS Feed
- Permalink
- Notify Moderator
Nov 19, 2015
01:24 PM
Correct. It's not a very good way of smoothing (in terms of the trade off between noise and resolution), but it makes calculation of confidence levels easy. See the info at the link I posted for details.
Nov 23, 2015
07:43 AM
- Mark as New
- Bookmark
- Subscribe
- Mute
- Subscribe to RSS Feed
- Permalink
- Notify Moderator
Nov 23, 2015
07:43 AM
Thanks. Finally found time to read the document in the link provided. Managed to code what I wanted both in mcad and excel (some stuff is actually easier to code in xls vba!). Might be looking at the option of a "weighting scheme" (mentioned in the link you posted)
[edit]
Just realised that there are funcitn in mcad that could do similar things
expsmooth(v, a) Returns a smoothed version of the data in vector v generated by exponential smoothing with weight a.
medfilt1d(M, n) Returns the multichannel signal M, filtered with a median filter of length n.
movavg(v, n) Returns a smoothed version of the data in vector v created by taking a moving average with a window of width n.
haven't looked at the detail but could be very useful. Functions are from the "Signal Processing/Time series Analysis/Smoothing/" which is what I am "investigating". Albeit with frequency at the x-axis and not time!
Regards
Nov 23, 2015
10:22 AM
- Mark as New
- Bookmark
- Subscribe
- Mute
- Subscribe to RSS Feed
- Permalink
- Notify Moderator
Nov 23, 2015
10:22 AM
There are lots of ways to smooth data. What's best often depends on your end goal. You should also look in the Data Analysis Extension pack, under "Smoothing and Windowing", and "B-splines and Least-Squares Splines".
Nov 23, 2015
11:08 AM
- Mark as New
- Bookmark
- Subscribe
- Mute
- Subscribe to RSS Feed
- Permalink
- Notify Moderator
Nov 23, 2015
11:08 AM
Thanks. I am looking at that too. I saw that one of the example (function MeansSmooth() uses the same approach to the one I "developed" in my test sheet!!)
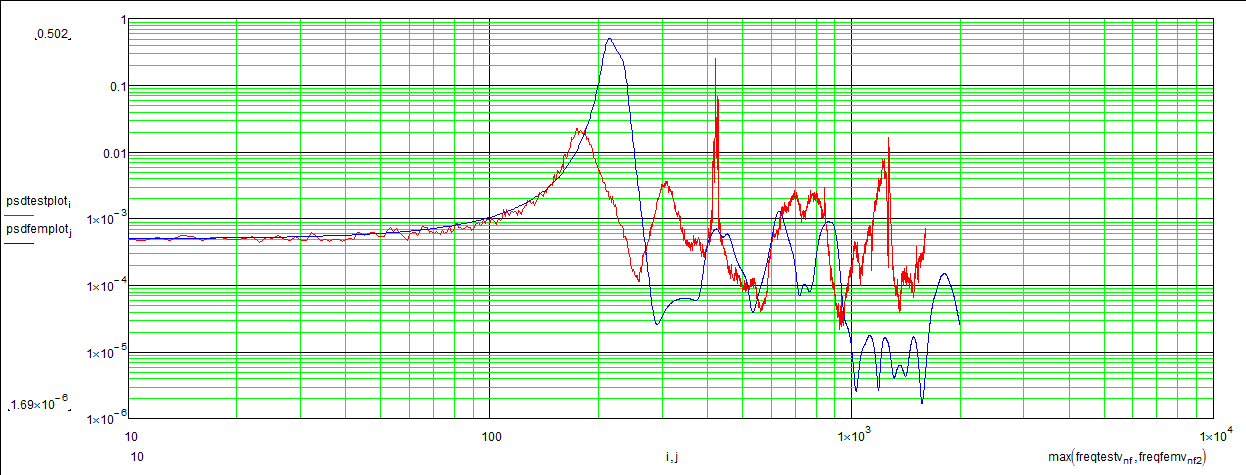
I am trying to compare test data (acceleration response under random vibration) vs. FE prediction (see attached for typical example). Nothing that has not been done before. I am therefore "investigating" ways of smoothing the data to do a point-to-point error calc. If one does a straight comparison FEM/Test at each freq. then some of the error are "huge". Smoothing the data over a window (I call it the frequency band) at each freq might help in the comparison/correlation.
Nov 23, 2015
11:46 AM
- Mark as New
- Bookmark
- Subscribe
- Mute
- Subscribe to RSS Feed
- Permalink
- Notify Moderator
Nov 23, 2015
11:46 AM
It's kind of hard to tell based only on a picture, and with log scales on the axes, but spline2 might be the best choice. It's based on statistics, so it's a little more objective than the other smoothing methods.
Your measured data looks a lot different to your FE prediction!
Nov 24, 2015
03:38 AM
- Mark as New
- Bookmark
- Subscribe
- Mute
- Subscribe to RSS Feed
- Permalink
- Notify Moderator
Nov 24, 2015
03:38 AM
picture attached might not be correct as I may have mixed up the data by mistake i.e. plotted the wrong vectors but at face value you are right (looks awful!).
I have found the example on the spline2(). Before I start looking into it. The method requires "w the vector of weights giving the estimated standard deviations of the random error". How does one decide on these weights? (I guess at each freq. points.)
Nov 24, 2015
08:22 AM
- Mark as New
- Bookmark
- Subscribe
- Mute
- Subscribe to RSS Feed
- Permalink
- Notify Moderator
Nov 24, 2015
08:22 AM
Do you know anything about the characteristics of the noise? Is it independent of the signal? Proportional to the signal? Something else? It's hard to tell from a log-log plot, but it does not look independent of the signal.
Nov 24, 2015
09:39 AM
- Mark as New
- Bookmark
- Subscribe
- Mute
- Subscribe to RSS Feed
- Permalink
- Notify Moderator
Nov 24, 2015
09:39 AM
Nothing much that I can add really. The idea is compare to PSD (responses). Can be response to a random input. One is the "truth" i.e. the real world and the other is what was predicted. Doing a straight fwd pt-to-pt comparison (ie at each freq) calculate an "error" can be very misleading.
While on this particular pt: There is no vlookup() function which returns the nearest value in Mathcad, is there? (just need to make sure!). I am currently assuming that both signals have the same freq. step but I may need to accommodate the need for different freq. vector (length and step).
back to the problem: I am therefore reading/investigating the idea of "smoothing" the signals (rightly or wrongly)
I have set up a test case for the spline2() (lifted from the example) and getting something out. Just need t understand the w vector.
not plotting on a log-log scale shows very little as the curve are all "squashed"
Nov 24, 2015
10:00 AM
- Mark as New
- Bookmark
- Subscribe
- Mute
- Subscribe to RSS Feed
- Permalink
- Notify Moderator
Nov 24, 2015
10:00 AM
Set all the weights to 1 (which would be correct if the noise is independent of signal).
Can you post one example data set?.
Nov 24, 2015
10:35 AM
- Mark as New
- Bookmark
- Subscribe
- Mute
- Subscribe to RSS Feed
- Permalink
- Notify Moderator
Nov 24, 2015
10:35 AM
sure. see attached. real = "real world" predict = "prediction"
Data (signal) are used to understand the functions available in mcad. The "format" is the only thing real
Nov 24, 2015
12:48 PM
- Mark as New
- Bookmark
- Subscribe
- Mute
- Subscribe to RSS Feed
- Permalink
- Notify Moderator
Nov 24, 2015
12:48 PM
This data is going to need some preprocessing. Up to 999 Hz the data has more than one frequency spacing. That's not a problem for the spline routines, but it is a problem for some smoothing routines. Starting at 1 kHz there are duplicate frequency values, and that is a problem for all the routines. It's what is throwing off spline2 and giving you garbage results (spline2 should throw an error with this data, but evidently doesn't). Do you know if the duplicate values were in the raw data, is is this some subsequent round-off problem?
Nov 24, 2015
08:02 PM
- Mark as New
- Bookmark
- Subscribe
- Mute
- Subscribe to RSS Feed
- Permalink
- Notify Moderator
Nov 24, 2015
08:02 PM
Try this.
I averaged the duplicate values. Spline2 does not like your data on a linear y-scale, but seems to work quite well with a log y-scale. The residuals are reasonably uniform, which implies that the assumption of weights all equal to 1 is OK (on a log y-scale, therefore not OK on a linear y-scale).
I don't think you will do any better than this with other smoothing approaches, because you have both broad features and sharp features (especially the resonance, or resonances, around 530 Hz). That means you need an adaptive smoother, and most are not. If this is not good enough it may be possible to do better with a more flexible version of spline2, with more options, but I would need to resurrect some old worksheets for that.
Nov 25, 2015
03:53 AM
- Mark as New
- Bookmark
- Subscribe
- Mute
- Subscribe to RSS Feed
- Permalink
- Notify Moderator
Nov 25, 2015
03:53 AM
Thanks a lot Richard for the worksheet. Much appreciated. Your point about using log for the y data is quite interesting
Apologies for data. Didn't notice that the copy-and-paste form xls to the notepad rounded up the numbers. I am concentrating on understanding the smoothing option!
I "forced" a new freq vector: freqrealv(I):=10+(i-1)*1.25. Interestingly enough if you then try to do for the bspline2()
x := freqrealv (where this is the new manually created vector)
y:=log(psdrealv) (not the averaged one using your function)
mcad crashes
Looks like I also need to "expand" the test mcad sheet as the length of the freq. vectors (real vs. predict) is not the same. I therefore cannot do a straightforward pt-to-pt comparison
error = (ypredic - yreal)/max(yreal). vlookup does not work (like in excel!)
Nov 25, 2015
12:47 PM
- Mark as New
- Bookmark
- Subscribe
- Mute
- Subscribe to RSS Feed
- Permalink
- Notify Moderator
Nov 25, 2015
12:47 PM
An advantage of spline smoothing is that you can easily redefine the x-points. In this case, just pass the x-points from the FE prediction to Binterp.

