
Turn on suggestions
Auto-suggest helps you quickly narrow down your search results by suggesting possible matches as you type.
Showing results for
Turn on suggestions
Auto-suggest helps you quickly narrow down your search results by suggesting possible matches as you type.
Showing results for
Community Tip - Did you know you can set a signature that will be added to all your posts? Set it here! X
Options
- Subscribe to RSS Feed
- Mark Topic as New
- Mark Topic as Read
- Float this Topic for Current User
- Bookmark
- Subscribe
- Mute
- Printer Friendly Page
graph
Nov 25, 2015
11:57 PM
- Mark as New
- Bookmark
- Subscribe
- Mute
- Subscribe to RSS Feed
- Permalink
- Notify Moderator
Nov 25, 2015
11:57 PM
graph
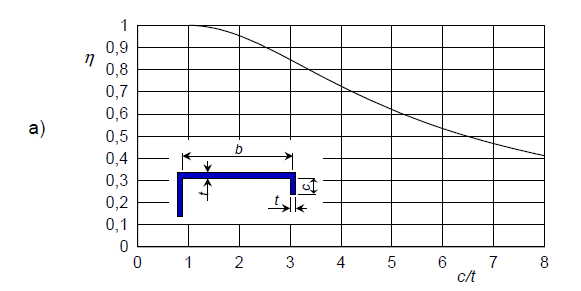
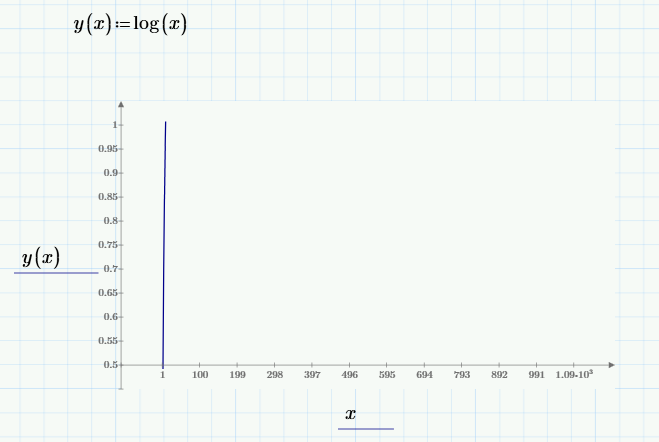
Hi. How can I make the graph in Mathcad prime similar to this figure. Do I have a missing formula ?

Solved! Go to Solution.
Labels:
- Labels:
-
Other
43 REPLIES 43
Dec 01, 2015
08:36 AM
- Mark as New
- Bookmark
- Subscribe
- Mute
- Subscribe to RSS Feed
- Permalink
- Notify Moderator
Dec 01, 2015
08:36 AM
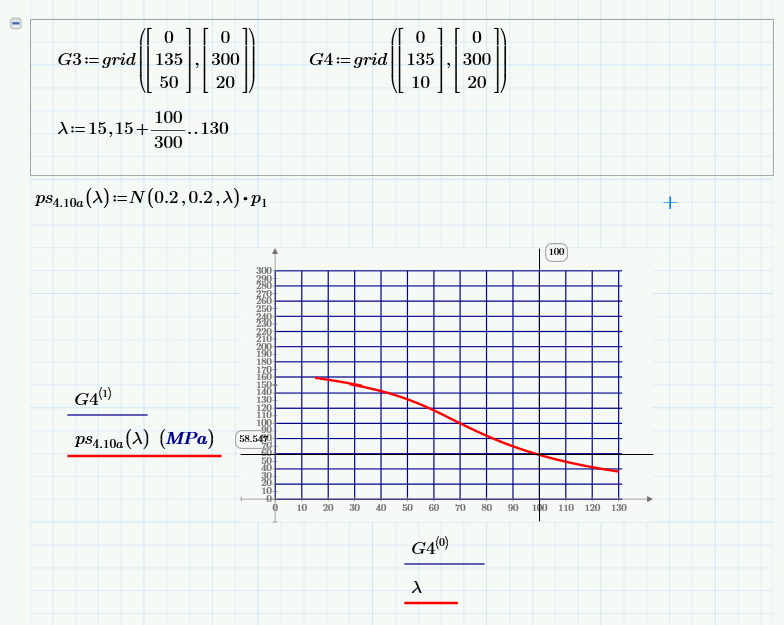
The range variable for plotting. How can I use that to put the beginning of the graph line exactly in p1 value = 160. I just assumed 15 base in my visual assumptions.
Dec 01, 2015
11:52 AM
- Mark as New
- Bookmark
- Subscribe
- Mute
- Subscribe to RSS Feed
- Permalink
- Notify Moderator
Dec 01, 2015
11:52 AM
Let Mathcad solve the equation ps.4.10a(L)=160MPa for L to get the start value for the range.
You may use the symbolic solve, a solve block or simply the root function to do so.
WE
Dec 01, 2015
07:22 PM
- Mark as New
- Bookmark
- Subscribe
- Mute
- Subscribe to RSS Feed
- Permalink
- Notify Moderator
Dec 01, 2015
07:22 PM
Thank you for your responses Werner.
Dec 17, 2015
07:55 AM
- Mark as New
- Bookmark
- Subscribe
- Mute
- Subscribe to RSS Feed
- Permalink
- Notify Moderator
Dec 17, 2015
07:55 AM
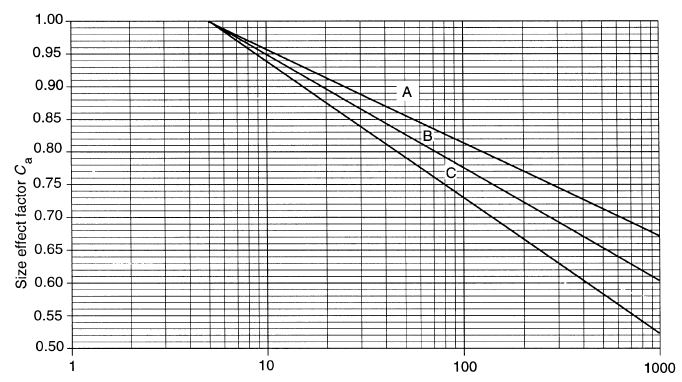
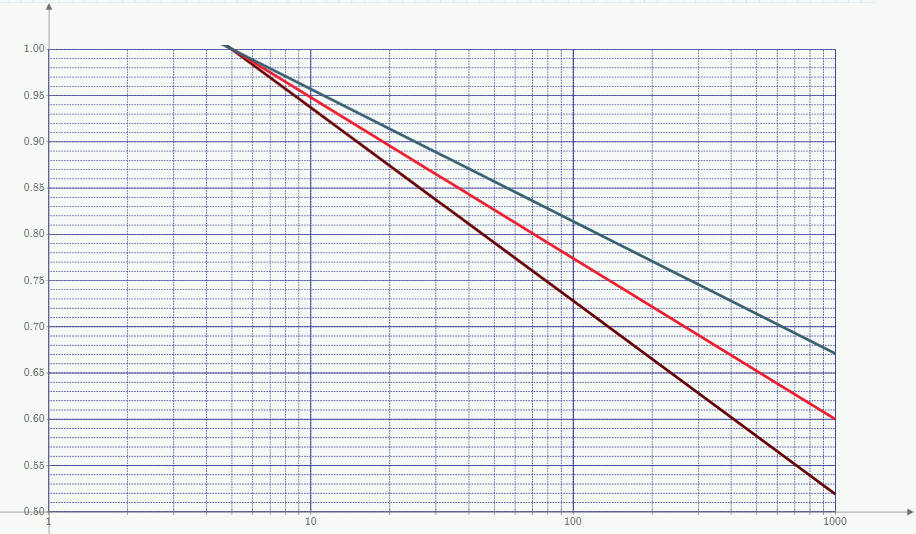
I have here a graph where grid line are not symmetrical. Are this possible to create using Mathcad prime ?
Dec 17, 2015
07:58 AM
- Mark as New
- Bookmark
- Subscribe
- Mute
- Subscribe to RSS Feed
- Permalink
- Notify Moderator
Dec 17, 2015
07:58 AM
Log scale is in Mathcad Prime, but no grid
Or
Dec 17, 2015
08:10 AM
- Mark as New
- Bookmark
- Subscribe
- Mute
- Subscribe to RSS Feed
- Permalink
- Notify Moderator
Dec 17, 2015
08:10 AM
How can I apply this to my graph .can you please help me ?
Thank you
Dec 17, 2015
08:12 AM
- Mark as New
- Bookmark
- Subscribe
- Mute
- Subscribe to RSS Feed
- Permalink
- Notify Moderator
Dec 17, 2015
08:12 AM
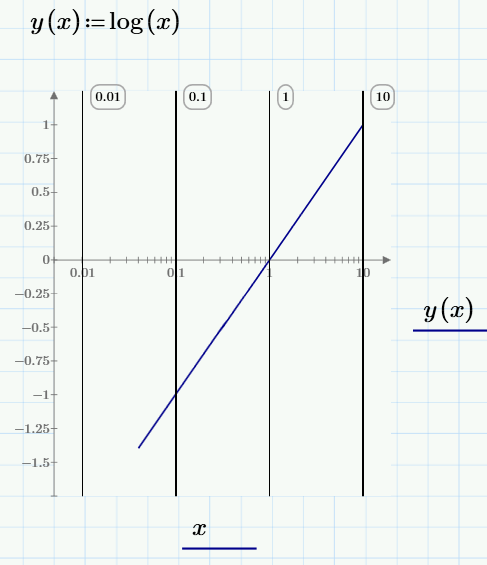
Why my graph are not the same?
Dec 17, 2015
08:19 AM
- Mark as New
- Bookmark
- Subscribe
- Mute
- Subscribe to RSS Feed
- Permalink
- Notify Moderator
Dec 17, 2015
08:19 AM
Because apparently you've defined x to be 1( although, that doesn't explain why you should get a vertical bar from y=0.5 to y=1...Hmm), instead of a range (or undefined, in which case for plotting it's automatically defnined from -10...10).
Define x:=1,2..100 (by typing x:1,2;100) just before you define f(x), and you should get a nice graph.
Luc
Dec 17, 2015
01:21 PM
- Mark as New
- Bookmark
- Subscribe
- Mute
- Subscribe to RSS Feed
- Permalink
- Notify Moderator
Dec 17, 2015
01:21 PM
LucMeekes wrote:
Because apparently you've defined x to be 1( although, that doesn't explain why you should get a vertical bar from y=0.5 to y=1...Hmm), instead of a range (or undefined, in which case for plotting it's automatically defnined from -10...10).
Define x:=1,2..100 (by typing x:1,2;100) just before you define f(x), and you should get a nice graph.
Luc
Look at the scale! What you see is not a vertical line but the graph of the log function. Look at (1;0) and (10;1).
Lex Dante seems not to know that his plot where the "grid line are not symmetrical" has a logarithmic scale at the x-axis.
@ Lex Dante:

Werner
Dec 17, 2015
11:23 AM
- Mark as New
- Bookmark
- Subscribe
- Mute
- Subscribe to RSS Feed
- Permalink
- Notify Moderator
Dec 17, 2015
11:23 AM
Lex Dante wrote:
I have here a graph where grid line are not symmetrical. Are this possible to create using Mathcad prime ?

Yes, its possible!
Regards
Werner
Dec 19, 2015
11:18 PM
- Mark as New
- Bookmark
- Subscribe
- Mute
- Subscribe to RSS Feed
- Permalink
- Notify Moderator
Dec 19, 2015
11:18 PM
Sorry for my late reply. Log grid are not a simple as I am thinking . It is very interesting to know about this , and I accept that I am still have a long road to step on to understand all this things. 
Dec 19, 2015
11:57 PM
- Mark as New
- Bookmark
- Subscribe
- Mute
- Subscribe to RSS Feed
- Permalink
- Notify Moderator
Dec 19, 2015
11:57 PM
Lex Dante wrote:
Sorry for my late reply. Log grid are not a simple as I am thinking . It is very interesting to know about this , and I accept that I am still have a long road to step on to understand all this things.
It should not be necessary to write ones own routines just to get a grid. It should be a one click plot option and in fact it is in most plot programs and also in Mathcad 15.
Primes plot capabilities unfortunately are ... lets say suboptimal, to keep this post polite.
Dec 19, 2015
11:41 PM
- Mark as New
- Bookmark
- Subscribe
- Mute
- Subscribe to RSS Feed
- Permalink
- Notify Moderator
Dec 19, 2015
11:41 PM
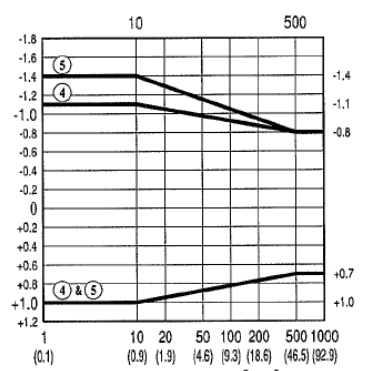
Good day ..
I have another graph where the vertical axis started from negative (-1.8) down to (+1.2) . is this also needs a special command to reverse the vertical graph as shown in the picture?
Dec 20, 2015
12:05 AM
- Mark as New
- Bookmark
- Subscribe
- Mute
- Subscribe to RSS Feed
- Permalink
- Notify Moderator
Dec 20, 2015
12:05 AM
Lex Dante wrote:
Good day ..
I have another graph where the vertical axis started from negative (-1.8) down to (+1.2) . is this also needs a special command to reverse the vertical graph as shown in the picture?
Unfortunately Prime is very limited when it comes to plotting. Unlike in Mathcad 15 (and below) we cannot reverse the axis in Prime. There is no special command or option available to do so.
WE
- « Previous
-
- 1
- 2
- Next »

