
Turn on suggestions
Auto-suggest helps you quickly narrow down your search results by suggesting possible matches as you type.
Showing results for
Turn on suggestions
Auto-suggest helps you quickly narrow down your search results by suggesting possible matches as you type.
Showing results for
Community Tip - Have a PTC product question you need answered fast? Chances are someone has asked it before. Learn about the community search. X
Options
- Subscribe to RSS Feed
- Mark Topic as New
- Mark Topic as Read
- Float this Topic for Current User
- Bookmark
- Subscribe
- Mute
- Printer Friendly Page
how to plot a function with the same variable multiplied
Apr 26, 2013
03:03 PM
- Mark as New
- Bookmark
- Subscribe
- Mute
- Subscribe to RSS Feed
- Permalink
- Notify Moderator
Apr 26, 2013
03:03 PM
how to plot a function with the same variable multiplied
Hello all,
I'm trying to plot a mathcad xy graph but with results dismal.
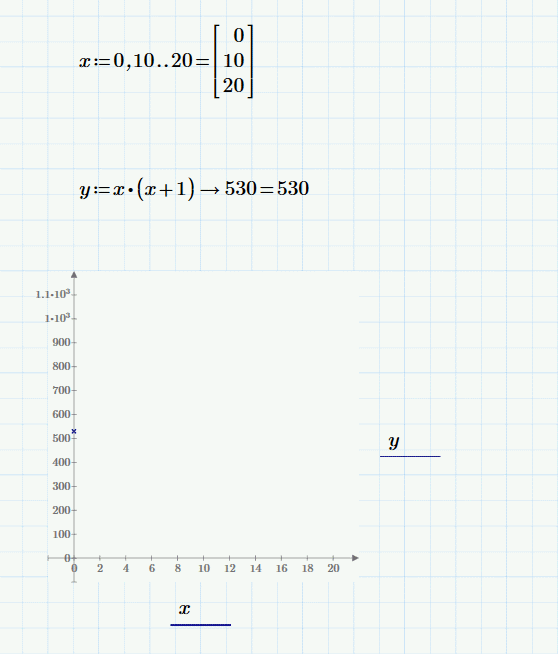
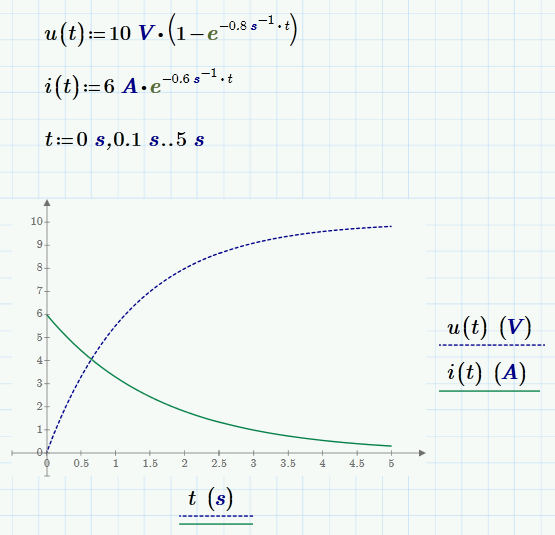
As you can see from the image , since the variable is repeated the array of points become an integer again and so the graph just shows one point.
I know i could multiply the function so that it become x^2+x but this in not a solution since this is just an example for a much more complicated function I need to plot, that would become simply a monster if i would multiplicate all toghether.
Hope there's a easy solution for this problem!
Thank you
Solved! Go to Solution.
Labels:
- Labels:
-
Statistics_Analysis
1 ACCEPTED SOLUTION
Accepted Solutions
Apr 26, 2013
04:42 PM
- Mark as New
- Bookmark
- Subscribe
- Mute
- Subscribe to RSS Feed
- Permalink
- Notify Moderator
Apr 26, 2013
04:42 PM
Hello ,
I solved apparently the problem was the unit definition. I have multiplied for the proper unit directly in the function and than changed the range of the graph appropriately, and this did the trick.
Thank you very much!
12 REPLIES 12
Apr 26, 2013
03:07 PM
- Mark as New
- Bookmark
- Subscribe
- Mute
- Subscribe to RSS Feed
- Permalink
- Notify Moderator
Apr 26, 2013
03:07 PM
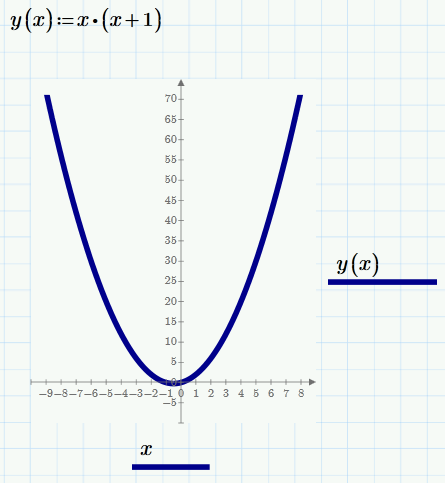
You have to define a function: y(x):=x*(x+1)
Then use y(x) in the plot, too.
You should in any case change your range variable x (you only define 3 points that way) or leave it away completely. You do not have to define x if you only want to plot unless you really want more control, but you can change the range of x directly in the graph, too.
For future questions: please attach a worksheet whenever possible (upper right - "Use advanced editor").
Apr 26, 2013
03:27 PM
- Mark as New
- Bookmark
- Subscribe
- Mute
- Subscribe to RSS Feed
- Permalink
- Notify Moderator
Apr 26, 2013
03:27 PM
Thank you for your answer,
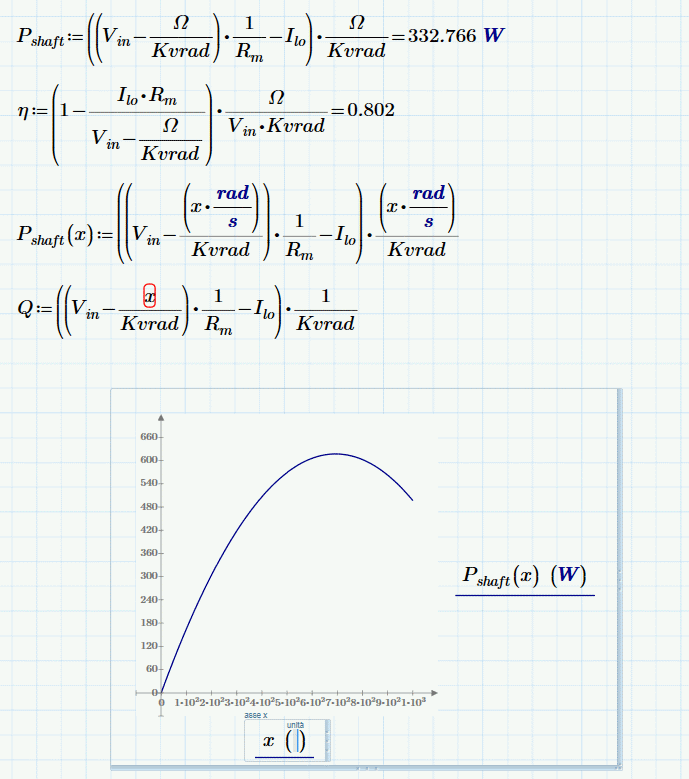
the reason why i define arange is because I need a larger range than -10 to 10 and besides the actual function I'd like to plot is this one:
As you can see no problem evaluating Pshaft when omega is given but if I try to plot the Pshaft(x) with x as a variable the program doesn't plot anything, if I define a range it plot just one point probably since it multipy the two matrices of points.
This issue is puzzling me !
Thank you very much!
Apr 26, 2013
03:55 PM
- Mark as New
- Bookmark
- Subscribe
- Mute
- Subscribe to RSS Feed
- Permalink
- Notify Moderator
Apr 26, 2013
03:55 PM
Can't debug a picture, you will have to post your worksheet.
As you write of matrices: In your first posting x was neither a matrix nor a vector (despite the fact it may look like a vector). Its important to distinguish between range variables (which are kind of implicit for-loops) and vectors. From the pic it can't be seen if a variable is a range, scalar or vector. They should be scalars, by no means ranges!
You can edit the default range -10..10 by editing the first, second and last value on each axis, but of course its not wrong defining a range variable
Apr 26, 2013
04:42 PM
- Mark as New
- Bookmark
- Subscribe
- Mute
- Subscribe to RSS Feed
- Permalink
- Notify Moderator
Apr 26, 2013
04:42 PM
Hello ,
I solved apparently the problem was the unit definition. I have multiplied for the proper unit directly in the function and than changed the range of the graph appropriately, and this did the trick.
Thank you very much!
Apr 26, 2013
04:47 PM
- Mark as New
- Bookmark
- Subscribe
- Mute
- Subscribe to RSS Feed
- Permalink
- Notify Moderator
Apr 26, 2013
04:47 PM
By the way is there any method to plot on a secondary Y axis ?
Apr 26, 2013
04:56 PM
- Mark as New
- Bookmark
- Subscribe
- Mute
- Subscribe to RSS Feed
- Permalink
- Notify Moderator
Apr 26, 2013
04:56 PM
Davide Strata wrote:
By the way is there any method to plot on a secondary Y axis ?
In Mathcad - yes, but unfortunately not (yet??) in PRIME.
Apr 26, 2013
05:03 PM
- Mark as New
- Bookmark
- Subscribe
- Mute
- Subscribe to RSS Feed
- Permalink
- Notify Moderator
Apr 26, 2013
05:03 PM
wow, that's weird
Apr 26, 2013
05:11 PM
- Mark as New
- Bookmark
- Subscribe
- Mute
- Subscribe to RSS Feed
- Permalink
- Notify Moderator
Apr 26, 2013
05:11 PM
Davide Strata wrote:
wow, that's weird
Why? Prime2 is not an enhancement or advancement of Mathcad 15. There are very very many features which are missing in Prime compared to Mathcad. PTC has decided to rewrite the program from scratch with the goal of giving it a more modern look and a user interface with better useability (a goal which they did not achieve in my opinion). Why they call a beta version 0.2 "Prime 2.0" is something I don't understand and heaven knows when Prime will live up to Mathcad (if ever). There is a reason you get a "free" mathcad 15 if you buy Prime2 - just in case you want the software use for real work 😉 And after all, you are right - its weird.
Apr 26, 2013
05:27 PM
- Mark as New
- Bookmark
- Subscribe
- Mute
- Subscribe to RSS Feed
- Permalink
- Notify Moderator
Apr 26, 2013
05:27 PM
I am not sure if you really mean a secondary ordinate with different scale, etc.
Of course (?) you can plot more than one graph and you are allowed to use different units. The values on the abscissa will have different meaning, but there will always be only one scale.
BTW, can it be that you forgot in your file to add the appropriate units to the values of your range variable x and were therefore forced to compensate for that in the function definition?
Apr 27, 2013
07:26 AM
- Mark as New
- Bookmark
- Subscribe
- Mute
- Subscribe to RSS Feed
- Permalink
- Notify Moderator
Apr 27, 2013
07:26 AM
Well, yes searching for the secondary axis I discovered the possibility of plotting more than one function per graph but the scale is totaly different so i would just see a thiny line near the origin and that's all.
Unfortunately I've just Prime installed but I will consider to start using mathcad 15 instead.
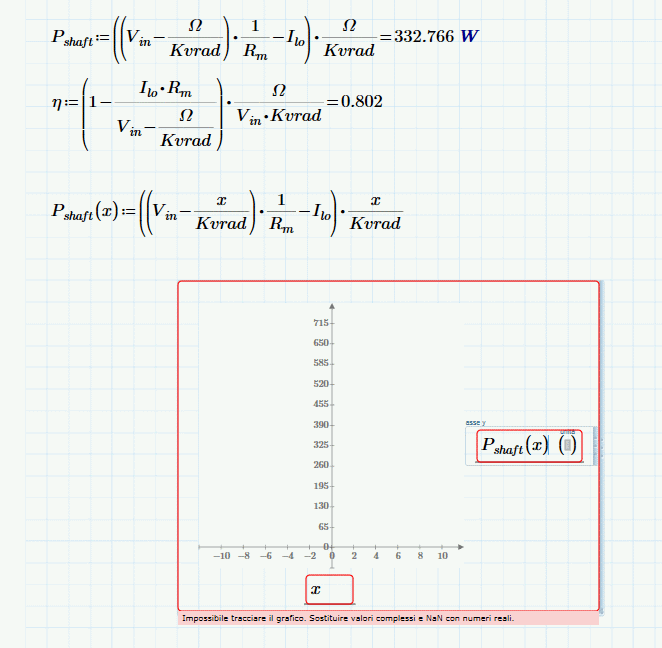
Regarding the units on the bottom label, I put rad/s there , the system automaticaly print out (rad*s)/s which is a non sense, and than stop ploting the function, so i had to plug the units into the function to make it work properly!
Thank you very much for your help!
Apr 27, 2013
08:33 AM
- Mark as New
- Bookmark
- Subscribe
- Mute
- Subscribe to RSS Feed
- Permalink
- Notify Moderator
Apr 27, 2013
08:33 AM
Regarding the units on the bottom label, I put rad/s there , the system automaticaly print out (rad*s)/s which is a non sense, and than stop ploting the function, so i had to plug the units into the function to make it work properly!
Think you can omit the rad anyway and it looks like you have declared your rangevariable x unitless, so if you put in seconds Mathcad has to compensate by adding 1/seconds. Being no real unit rad will be ignored.
So while you can compensate for it in your function definition, it would be more consistent if you add the units at the definition of x (three times, like in my screenshot, for start, second value and end value).
Concerning Mathcad15: Maybe I was a bit to harsh in my description of Primes inabilities. I'm a longtime Mathcad user, am used to the (now old) interface and know about a lot of the features the software has. So I quickly spot the missing features of Prime, notice the long time it takes the software to start and quite often the annyoing time lag of the userinterface in reacting on a click or some other action. So - I don't like Prime at all and if you scan through the posts in this forum you'll see that I'm not alone.
But as a new user is questionable if its worth getting familiar with MC15 as (sad as it may be) Prime seems to be he future. I'm quite sure there never will be a Mathcad 16 and sooner or later (and I hope: later) PTC will not bundle Prime with Mathcad15 anymore and will stop supporting MC15 - no maintainance releases, etc. I don't know of any roadmap but it sure will happen that way. So unless you really need a missing feature urgently, it's probably better for a new user to stay with Prime and hope for improvements. ANd if you are after publication quality plots, neither of the two will do the job as was dicussed here quite some times.
This does not mean you shouldn't install MC15 parallel with Prime, though. You can experiment and judge yourself (MC15 will have its quirks, too) and its the only way to be able to convert older worksheets in Prime format, in case you find anything useful here or anywhere else.
Jul 01, 2016
06:52 AM
- Mark as New
- Bookmark
- Subscribe
- Mute
- Subscribe to RSS Feed
- Permalink
- Notify Moderator
Jul 01, 2016
06:52 AM
Hello everyone,
Does anybody know, if PTC developed the secondary axis function already?
It is horrible without it, especially in case of a Bode plot. I would like to see phase shift and gain on the same graph.
Any hints?
Thanks!

