
Turn on suggestions
Auto-suggest helps you quickly narrow down your search results by suggesting possible matches as you type.
Showing results for
Turn on suggestions
Auto-suggest helps you quickly narrow down your search results by suggesting possible matches as you type.
Showing results for
Community Tip - Did you know you can set a signature that will be added to all your posts? Set it here! X
Options
- Subscribe to RSS Feed
- Mark Topic as New
- Mark Topic as Read
- Float this Topic for Current User
- Bookmark
- Subscribe
- Mute
- Printer Friendly Page
table generation
Oct 10, 2013
05:17 PM
- Mark as New
- Bookmark
- Subscribe
- Mute
- Subscribe to RSS Feed
- Permalink
- Notify Moderator
Oct 10, 2013
05:17 PM
table generation
Hello,
Attached is a mathcad14 sheet.Is it possible to have mathcad generate a table after the automation of the calculation? the table is shown on the right. I did set up some equations on the left side that gives some of the values in the table. I need to automate the process because i am repeating the same steps for each element. Thanks!
Solved! Go to Solution.
Labels:
- Labels:
-
Other
1 ACCEPTED SOLUTION
Accepted Solutions
Oct 11, 2013
03:26 PM
- Mark as New
- Bookmark
- Subscribe
- Mute
- Subscribe to RSS Feed
- Permalink
- Notify Moderator
Oct 11, 2013
03:26 PM
I am not sure but it looks like he is just after a neatly formatted table as he is possible used from spreadsheets.
So as I understand every set of (r,t,theta,TF) would yield a table as he had made by hand.
In this can be handled by a matrix which can be formatted as table or as marix as shown below, but you won't be able to achieve the look and format comfort of Excel.
But then, I may be wrong and something else is needed.

12 REPLIES 12
Oct 10, 2013
06:23 PM
- Mark as New
- Bookmark
- Subscribe
- Mute
- Subscribe to RSS Feed
- Permalink
- Notify Moderator
Oct 10, 2013
06:23 PM
I have no idea from your description what you are after.
But it looks to me that you have to make the values you want to calculate for "each element" functions dependend on whatever values which change from "elelemnt" to "element".
Oct 11, 2013
10:29 AM
- Mark as New
- Bookmark
- Subscribe
- Mute
- Subscribe to RSS Feed
- Permalink
- Notify Moderator
Oct 11, 2013
10:29 AM
Hello Werner,
i am attaching new mathcad file. The values in the table are calculated on the left side. is there away i could show these calculated values in table format as done by hand? Thanks a lot!
Oct 11, 2013
10:50 AM
- Mark as New
- Bookmark
- Subscribe
- Mute
- Subscribe to RSS Feed
- Permalink
- Notify Moderator
Oct 11, 2013
10:50 AM
So the question is to just put all those calculated values in a nice and neat table for display?
You can't get results which would look as godd as you can make them look in a spreadsheet.
All you can do is to put all the values in a matrix. For headers, etc. you can assign textstrings to the appropriate matrix elements, but I guess the result would be far away from good looking.
As you wrote about repeating the calculation i thought you were after some kind of iteration.
Oct 10, 2013
06:37 PM
- Mark as New
- Bookmark
- Subscribe
- Mute
- Subscribe to RSS Feed
- Permalink
- Notify Moderator
Oct 10, 2013
06:37 PM
Generally, a table implies changing one or more parameters in some sort of sequence. You can do that by creating indexed variables, something like i:=0;5 L<sub>i</sub>:=5*i.
Next, you can just replace the single-valued variable with the indexed variable, and get a list of results from the equation.
TTFN
Oct 11, 2013
03:26 PM
- Mark as New
- Bookmark
- Subscribe
- Mute
- Subscribe to RSS Feed
- Permalink
- Notify Moderator
Oct 11, 2013
03:26 PM
I am not sure but it looks like he is just after a neatly formatted table as he is possible used from spreadsheets.
So as I understand every set of (r,t,theta,TF) would yield a table as he had made by hand.
In this can be handled by a matrix which can be formatted as table or as marix as shown below, but you won't be able to achieve the look and format comfort of Excel.
But then, I may be wrong and something else is needed.
Oct 11, 2013
03:32 PM
- Mark as New
- Bookmark
- Subscribe
- Mute
- Subscribe to RSS Feed
- Permalink
- Notify Moderator
Oct 11, 2013
03:32 PM
This looks really good. i am not expecting it to look as good as excel, but it looks very decent. Thanks!
Oct 11, 2013
03:36 PM
- Mark as New
- Bookmark
- Subscribe
- Mute
- Subscribe to RSS Feed
- Permalink
- Notify Moderator
Oct 11, 2013
03:56 PM
- Mark as New
- Bookmark
- Subscribe
- Mute
- Subscribe to RSS Feed
- Permalink
- Notify Moderator
Oct 11, 2013
03:56 PM
Thanks so much. You are great at this!
Oct 11, 2013
04:11 PM
- Mark as New
- Bookmark
- Subscribe
- Mute
- Subscribe to RSS Feed
- Permalink
- Notify Moderator
Oct 11, 2013
04:11 PM
Hello Werner,
how did you make a matrix to display as a table as you show in the second yellow table table1?Thanks!
Oct 11, 2013
04:25 PM
- Mark as New
- Bookmark
- Subscribe
- Mute
- Subscribe to RSS Feed
- Permalink
- Notify Moderator
Oct 11, 2013
04:25 PM
Open the "Result Format" menu (e.g. by left double clicking the matrix), tab "Display options" and change 'matrix display style' from 'Automatic' to "Table". After confirming with OK you see the table with labels and font size 10.
By right clicking the table you can change the placement with respect to the LHS by chosing Alignment and the labels (on/off) as well as the font in Properties.
Oct 11, 2013
05:22 PM
- Mark as New
- Bookmark
- Subscribe
- Mute
- Subscribe to RSS Feed
- Permalink
- Notify Moderator
Oct 11, 2013
05:22 PM
Thanks Werner!
in the routine you wrote, what does tmp4,4 <---0 mean? or what does tmp4,4 represent?
also where in routine did you assign values for (row,column) = (2,2),2(2,3),(2,4).? i see value assigned for (2,1) and (2,5).Thanks!
Oct 11, 2013
06:28 PM
- Mark as New
- Bookmark
- Subscribe
- Mute
- Subscribe to RSS Feed
- Permalink
- Notify Moderator
Oct 11, 2013
06:28 PM
in the routine you wrote, what does tmp4,4 <---0 mean? or what does tmp4,4 represent?
After the augment command which follows the line you referenced I have created a 5x6 local matrix tbl which contains the necessary row and column headers and the data area contains zero. I could have done it that way:
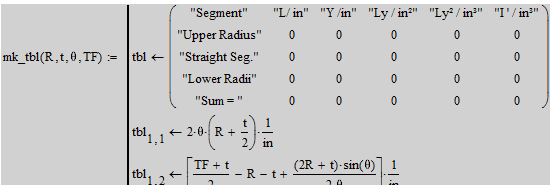
but it seems that I had my creative half an hour and so I first created a column vector tbl with the row headers, then a row vector (1x5 vector) with the column labels. to mount them toghether with augment to get the matrix wanted, I had to blow up this row vector to a 5x5 matrix. lbl[4,4<--0 writes a 0 in the fifth row, fifth column and will automaticalle fill all the other cells with zeros, so that matrix is created.
also where in routine did you assign values for (row,column) = (2,2),2(2,3),(2,4).? i see value assigned for (2,1) and (2,5).Thanks!
Same mechanism as described before, Mathcad had already filles those cells with zeros, so there is no need to assign explicitely a zero again. (2,2) is defined in your sheet as y-y, so it will be zero, no matter what you would chose for R, t, etc. (2,3) and (2,4) are defined in your sheet as expressions containing (2,2) (=y.straight_segments) as a factor, so they, too, will be zero for all tables.

