
Turn on suggestions
Auto-suggest helps you quickly narrow down your search results by suggesting possible matches as you type.
Showing results for
Turn on suggestions
Auto-suggest helps you quickly narrow down your search results by suggesting possible matches as you type.
Showing results for
Community Tip - Your Friends List is a way to easily have access to the community members that you interact with the most! X
Options
- Subscribe to RSS Feed
- Mark Topic as New
- Mark Topic as Read
- Float this Topic for Current User
- Bookmark
- Subscribe
- Mute
- Printer Friendly Page
x-y plot rectangular coordinates
Nov 26, 2016
10:51 AM
- Mark as New
- Bookmark
- Subscribe
- Mute
- Subscribe to RSS Feed
- Permalink
- Notify Moderator
Nov 26, 2016
10:51 AM
x-y plot rectangular coordinates
Hi
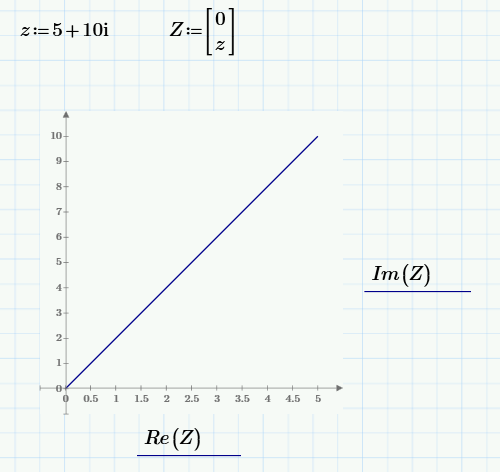
Newbie to Mathcad Prime, How do I plot a straight line from the origin using complex numbers.
Eg 10+5i complex number.
Straight line between (0,0) and (10,5) using x-y plot.
Any assistance much appreciated.
Labels:
- Labels:
-
Other
11 REPLIES 11
Nov 27, 2016
12:06 PM
- Mark as New
- Bookmark
- Subscribe
- Mute
- Subscribe to RSS Feed
- Permalink
- Notify Moderator
Nov 27, 2016
12:06 PM
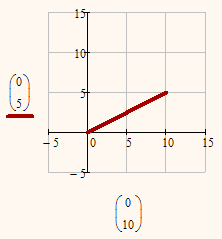
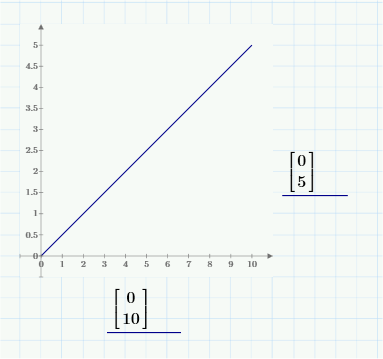
Write the column vector consisting of the x-coordinates of the two points in the placeholder for the abscissa and the column vector consisting of the y-coordinates in the placeholder for the ordinate.
Here is what it looks like in Mathcad15, but it should work similarly in Prime, too.
Nov 27, 2016
05:11 PM
- Mark as New
- Bookmark
- Subscribe
- Mute
- Subscribe to RSS Feed
- Permalink
- Notify Moderator
Nov 28, 2016
11:30 AM
- Mark as New
- Bookmark
- Subscribe
- Mute
- Subscribe to RSS Feed
- Permalink
- Notify Moderator
Nov 28, 2016
08:04 PM
- Mark as New
- Bookmark
- Subscribe
- Mute
- Subscribe to RSS Feed
- Permalink
- Notify Moderator

Nov 28, 2016
11:59 PM
- Mark as New
- Bookmark
- Subscribe
- Mute
- Subscribe to RSS Feed
- Permalink
- Notify Moderator
Nov 28, 2016
11:40 PM
- Mark as New
- Bookmark
- Subscribe
- Mute
- Subscribe to RSS Feed
- Permalink
- Notify Moderator
Nov 28, 2016
11:40 PM
How do I plot a straight line?
Any assistance much appreciated.
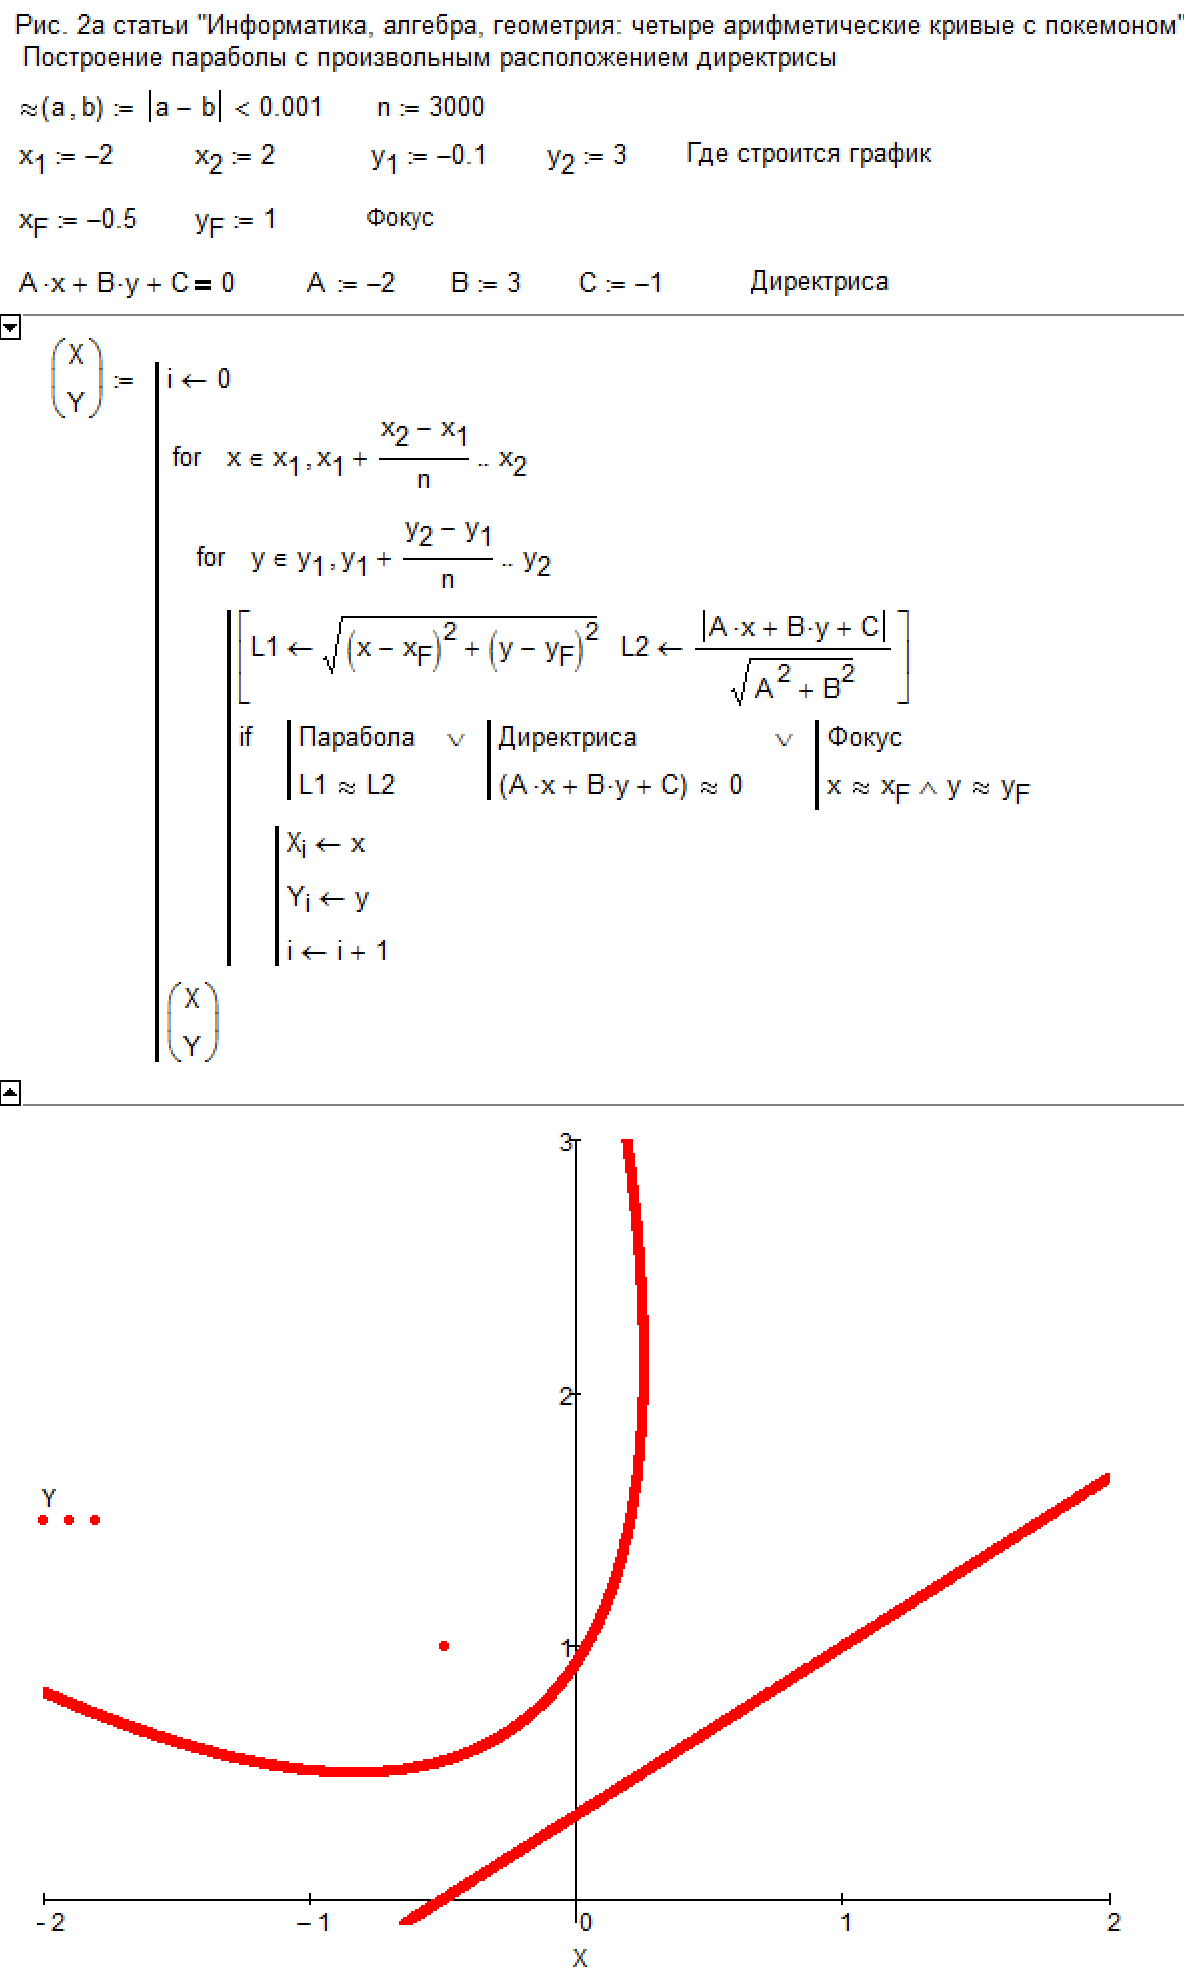
A general way to plot lines (curves) and points
Nov 29, 2016
05:38 PM
- Mark as New
- Bookmark
- Subscribe
- Mute
- Subscribe to RSS Feed
- Permalink
- Notify Moderator
Nov 29, 2016
05:38 PM
Thanks for the feedback. Is it possible to fix the axis to a certain length?
Dec 01, 2016
01:30 PM
- Mark as New
- Bookmark
- Subscribe
- Mute
- Subscribe to RSS Feed
- Permalink
- Notify Moderator
Dec 01, 2016
01:30 PM
Yes, that happens automatically.
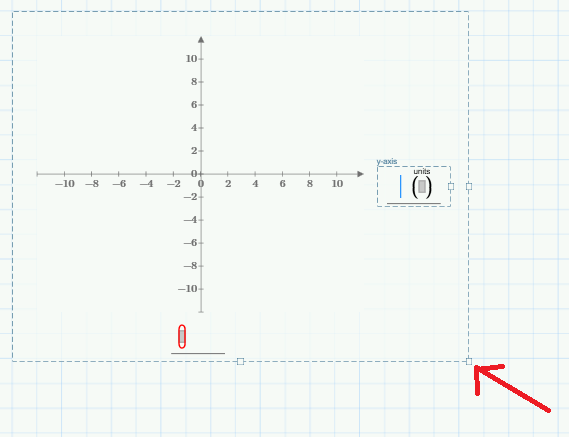
Below is an empty plot (nothing filled in yet). You can set the size of the plot container by pulling the small square at the lower right side of it, pointed to by the red arrow in the drawing below. That sets the length of both the x- and y-axes:
When you actually put expressions to plot, this is what you get:
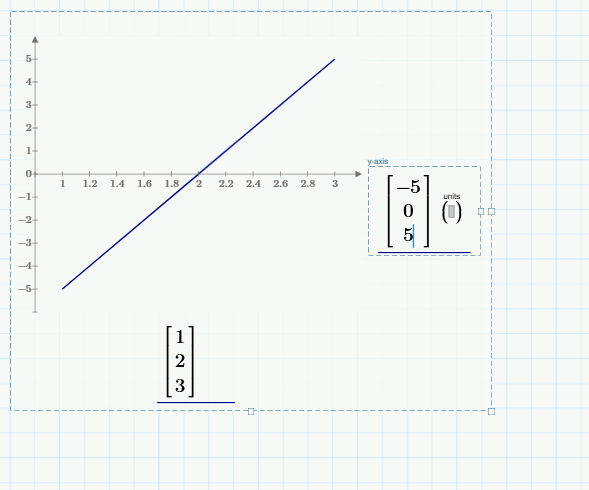
The plot container grows, but the length of x- and y-axes remain the same.
But notice that the scales are different now. If you want those to be fixed, that's anothe matter.
Prime does not seem to have a way set those (like Mathcad 15 or before do have). What you can do is add another trace with the (minimum) axis limits you want, and make the trace invisible by setting its colour. below I've changed the scales back to + and -10 for both axes The trace colour is set to white, and the line type is dashed to minimally interfere with the blue trace:

Success!
Luc
Dec 01, 2016
01:46 PM
- Mark as New
- Bookmark
- Subscribe
- Mute
- Subscribe to RSS Feed
- Permalink
- Notify Moderator
Dec 01, 2016
01:46 PM
You can manually edit the first, second and last value on each axis.
Simply click and if you are lucky you hit the right spot despite the tiny font used and are able to change the value.

Dec 01, 2016
03:08 PM
- Mark as New
- Bookmark
- Subscribe
- Mute
- Subscribe to RSS Feed
- Permalink
- Notify Moderator
Dec 01, 2016
03:08 PM
Ah, I didn't know that. Thanks!
Just found out that you can also control the position of one axis with respect to the other.
When you move the cursor to the crosspoint of the axes, the crosspoint values light up. You can grab one and move the corresponding axis to any tick mark of the other axis.
That';s neat.
Luc
Dec 01, 2016
03:34 PM
- Mark as New
- Bookmark
- Subscribe
- Mute
- Subscribe to RSS Feed
- Permalink
- Notify Moderator
Dec 01, 2016
03:34 PM
When you move the cursor to the crosspoint of the axes, the crosspoint values light up. You can grab one and move the corresponding axis to any tick mark of the other axis.
You don't even have to move the cursor to the crosspoint. You can grab any axis anywhere (the cursor turns in a double arrow) and move it around.
If you got lost you can reset it here:


