
Turn on suggestions
Auto-suggest helps you quickly narrow down your search results by suggesting possible matches as you type.
Showing results for
Turn on suggestions
Auto-suggest helps you quickly narrow down your search results by suggesting possible matches as you type.
Showing results for
Community Tip - Learn all about PTC Community Badges. Engage with PTC and see how many you can earn! X
- Community
- Creo+ and Creo Parametric
- 3D Part & Assembly Design
- Re: Motor Profiles - study tools and observations
Options
- Subscribe to RSS Feed
- Mark Topic as New
- Mark Topic as Read
- Float this Topic for Current User
- Bookmark
- Subscribe
- Mute
- Printer Friendly Page
Motor Profiles - study tools and observations
Mar 24, 2013
09:32 PM
- Mark as New
- Bookmark
- Subscribe
- Mute
- Subscribe to RSS Feed
- Permalink
- Notify Moderator
Mar 24, 2013
09:32 PM
Motor Profiles - study tools and observations
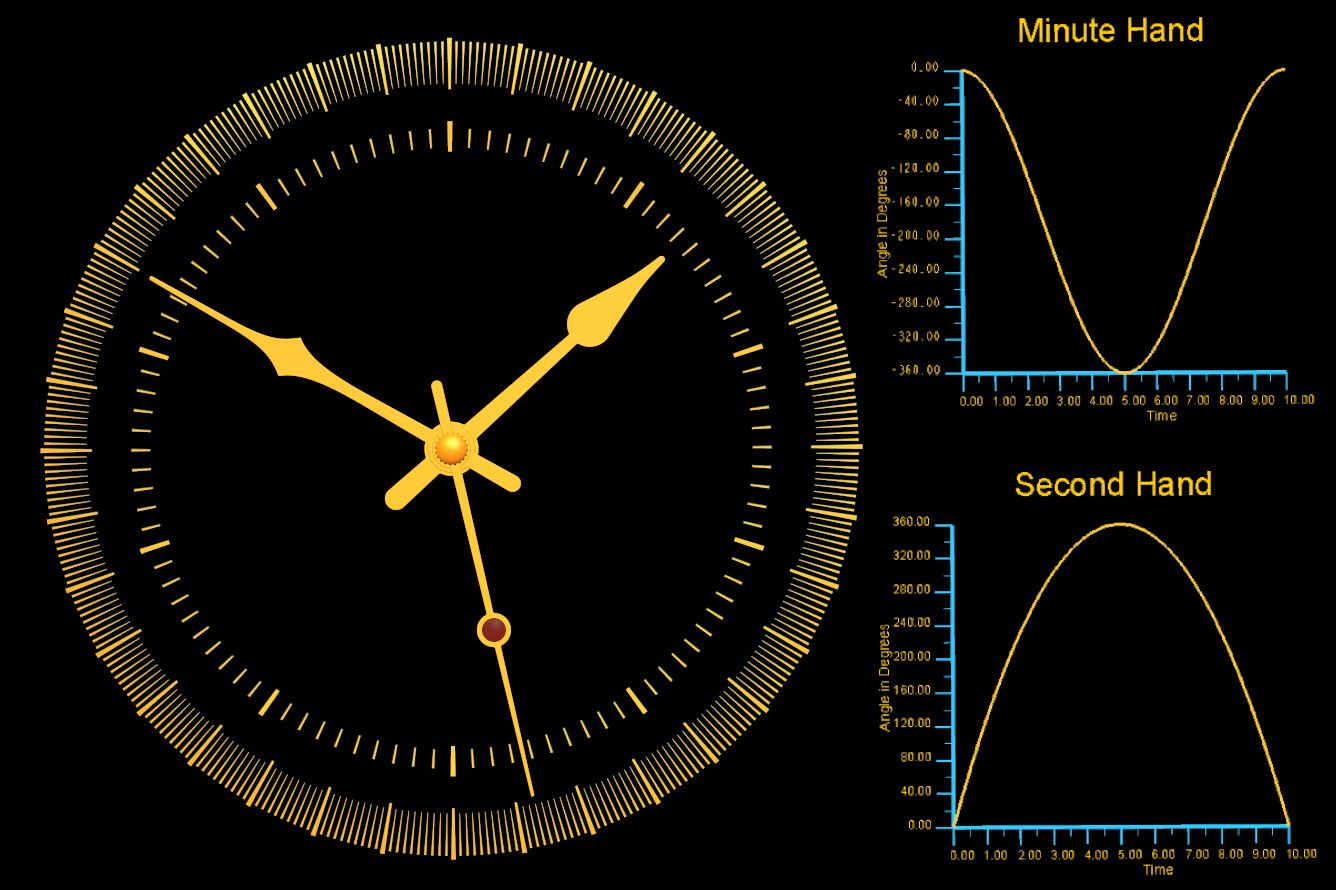
When I created the Clock document, I intended to use the basic concept for furthering insights into servo motors.
I did just that with the following. When defining a servo motor, you get a 10 "second" window in the available graphs.
I was not considering clearing up all the mysteries of defining servo motors in this document. I welcome anyone to add additional information that makes defining motors easier or even interesting applications. In this instance, I learned that the "position" value in the graphs is key to understanding where a motor is at any point in time.
I created the new face to subdivided measurements in degrees totaling 360 with highlights at every 10 degrees. For the purpose of gauging time, the hour hand is calibrated to "10" for a full revolution. The highlights are placed at every "second" and a total of 100 ticks to match the Excel output. This is the "constant" by which to compare the "minute" and "second" hands.
After playing with the dialogs and the various servo motor profiles, I found the parabolic and cosine curves I was looking for. It took some experimentation to begin understanding what the values mean and what they actually do. I exported the graphs to Excel; I compared and tried to understand the formula that pops up if you hover over the Magnitude options; I began to glean the variation between the different specifications: Position, Velocity, and Acceleration to which the formula is applied. Eventually things started to make sense to where I could manipulate the curve to values I wanted and apply them to what I was expecting. I also found the limitation in the 10 "second" graph. Not to worry however, because you can extrapolate the formula in Excel to whatever time period you want.
A quick note should be added for the Analysis dialog as well. By default, the end time is "10" when defining the servo motors. Very few options allow you to change that. In order to make a solid comparison between the servo motor graphs and the Analysis, I recommend you leave the end time set to 10. What you will want to change is the Frame Rate, or "coarseness" of the motion. in the case of the included video, I set this 100 resulting in 1001 frames when I captured the video.
Of course, venturing into longer durations by changing the end times is good for understanding. What I learned is that many of these formula are not cyclical... they go into a runaway scenario. It is advised to plot out those curves in Excel to the intended end point if you cannot find a good reason for your motor to suddenly go into a runaway situation... or seemingly stop for no reason.
And last for this part of the discussion is the graphs on the screen when capturing the video. I like the fact that we can change so many parameters to come up with such a nice looking graph. And as much as I like it, I dislike it for the same reason, because the style you end up with is not something you can save or apply. Yet I digress... the only way to capture a really nice video is to use the "Capture" option in the animate dialog. It does a very nice job of capturing a very smooth graphics window without any dropped frames... SWEET!... but you can only capture what is in the graphics window. I tried CamStudio for a screen capture video but it does not deliver a smooth video. It seems that over time, Microsoft really falls short of providing an OS with power over video capture. I simply could not get a high quality video any other way even on an I7 quad core! So in the end, I formatted the graphs, all 25-someodd settings each and did a screen capture to insert the bitmap as an image placed on the front facing datum plane. I matched the screen's background to the image (black) and used the "Capture" routine and this time the graphs were included.
The video:
I have attached the project file and the video for your convenience. Creo 2.0 full version.
Again, this document is open for collaboration. Please share your Servo Motor applications.
Enjoy!
This thread is inactive and closed by the PTC Community Management Team. If you would like to provide a reply and re-open this thread, please notify the moderator and reference the thread. You may also use "Start a topic" button to ask a new question. Please be sure to include what version of the PTC product you are using so another community member knowledgeable about your version may be able to assist.
3 REPLIES 3
Mar 25, 2013
08:38 PM
- Mark as New
- Bookmark
- Subscribe
- Mute
- Subscribe to RSS Feed
- Permalink
- Notify Moderator
Mar 25, 2013
08:38 PM
Wow! I wish I would have found this earlier 
http://www.sharptechdesign.com/Tutorials/Mechanism_WF2/MDX_WF2_TOC.htm
May 17, 2013
04:28 PM
- Mark as New
- Bookmark
- Subscribe
- Mute
- Subscribe to RSS Feed
- Permalink
- Notify Moderator
May 17, 2013
04:28 PM
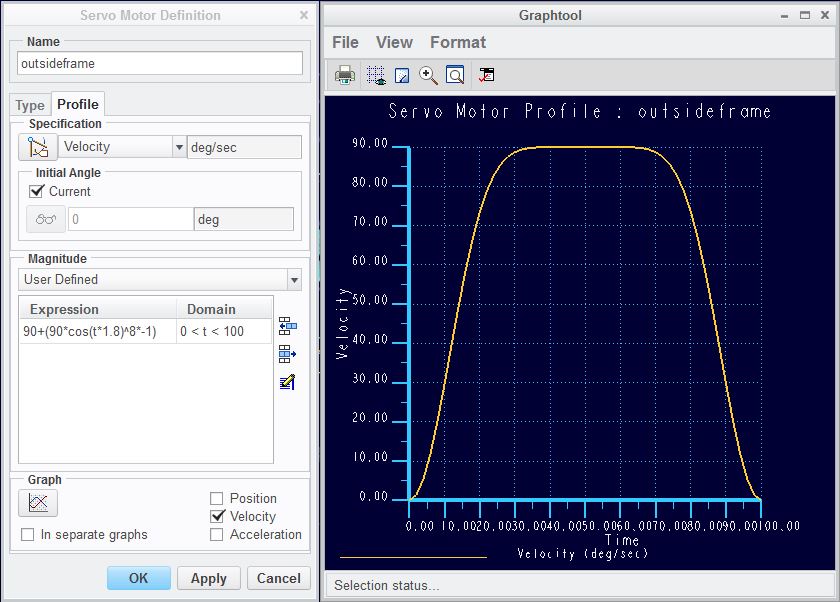
Next time you need a ramped velocity curve, give this formula a try:
90+(90*cos(t*1.8)^8*-1) - The *1.8 is related to the time domain to finish at 180
Sep 27, 2013
01:13 AM
- Mark as New
- Bookmark
- Subscribe
- Mute
- Subscribe to RSS Feed
- Permalink
- Notify Moderator
Sep 27, 2013
01:13 AM
Hi Antonius Dirriwachter i need this profile for a servo motor whaich has the exact shape but the time domain is from 6 to 12 and the angle to be covered in this time domian ie 6 seconds is 1800 degree.the profile is for velocity.Please help
