
Turn on suggestions
Auto-suggest helps you quickly narrow down your search results by suggesting possible matches as you type.
Showing results for
Turn on suggestions
Auto-suggest helps you quickly narrow down your search results by suggesting possible matches as you type.
Showing results for
Community Tip - You can Bookmark boards, posts or articles that you'd like to access again easily! X
- Community
- Creo+ and Creo Parametric
- Analysis
- Re: Crankshaft analysis with varying loads
Options
- Subscribe to RSS Feed
- Mark Topic as New
- Mark Topic as Read
- Float this Topic for Current User
- Bookmark
- Subscribe
- Mute
- Printer Friendly Page
Crankshaft analysis with varying loads
Apr 16, 2019
12:47 PM
- Mark as New
- Bookmark
- Subscribe
- Mute
- Subscribe to RSS Feed
- Permalink
- Notify Moderator
Apr 16, 2019
12:47 PM
Crankshaft analysis with varying loads
I'm trying to set up a design study where I rotate a crankshaft and the load vectors and magnitudes vary based on the rotation angle. I was told I could create a user parameter, which is the angle, and then link the load values and/or directions to the angle parameter using relations. So when the angle value changes, the loads change accordingly.
Can someone show me how I would write a relation like that?
or
Does someone have another way to do this?
Currently the crankshaft is an assembly file where the load vector is defined with a coordinate system. So when the assembly angle (crankshaft angle) is changed the csys changes to apply the bearing load at the correct vector.
Solved! Go to Solution.
Labels:
- Labels:
-
Simulate
1 ACCEPTED SOLUTION
Accepted Solutions
Apr 16, 2019
03:42 PM
- Mark as New
- Bookmark
- Subscribe
- Mute
- Subscribe to RSS Feed
- Permalink
- Notify Moderator


27 REPLIES 27
Apr 16, 2019
02:18 PM
- Mark as New
- Bookmark
- Subscribe
- Mute
- Subscribe to RSS Feed
- Permalink
- Notify Moderator
Apr 16, 2019
02:18 PM
First create the parameter to hold the load value. (Tools Parameters - + )

Then show the angle dimension before entering Tools - relations so you can pick the dimension.
Then Tools-relations. the angle dimension I have is d4696 but yours will be a different ID. My example uses a cosine function. Replace that with the function you need.

Regenerate the model
Verify Parameter is now driven by a relation and locked. Tools - parameters

Now use the parameter by just entering its name in the load magnitude box.

The design study would then as it varies the angle dimension, automatically update the load magnitude due to the relation and the parameter connection.
Apr 16, 2019
02:32 PM
- Mark as New
- Bookmark
- Subscribe
- Mute
- Subscribe to RSS Feed
- Permalink
- Notify Moderator
Apr 16, 2019
02:32 PM
Oops. that reply was me incorrectly using my other log-in.
Apr 16, 2019
03:04 PM
- Mark as New
- Bookmark
- Subscribe
- Mute
- Subscribe to RSS Feed
- Permalink
- Notify Moderator
Apr 16, 2019
03:04 PM
Thank you. I think that's a good start. But what if my function is more complicated than sin/cos? Can I input a table? This is my input torque curve, for example.

Apr 16, 2019
03:42 PM
- Mark as New
- Bookmark
- Subscribe
- Mute
- Subscribe to RSS Feed
- Permalink
- Notify Moderator
Apr 16, 2019
03:42 PM
Apr 16, 2019
03:51 PM
- Mark as New
- Bookmark
- Subscribe
- Mute
- Subscribe to RSS Feed
- Permalink
- Notify Moderator
Apr 16, 2019
03:51 PM
Awesome. I'll look into that. I swear I scoured the knowledge base for this...Thanks again
Apr 17, 2019
02:06 AM
- Mark as New
- Bookmark
- Subscribe
- Mute
- Subscribe to RSS Feed
- Permalink
- Notify Moderator
Apr 17, 2019
02:06 AM
Hi, but with the Graph Evaluation Function you can only sketch and not import data (points) to correctly represent the plot. Or this last option there is and I don't know...
Apr 17, 2019
10:47 AM
- Mark as New
- Bookmark
- Subscribe
- Mute
- Subscribe to RSS Feed
- Permalink
- Notify Moderator
Apr 17, 2019
10:47 AM
That's correct. In order to input the data I had to:
1. Copy and paste the data from excel to notepad
2. Change the extension of the notepad file from .txt to .pts
3. Create datum points using the .pts file under "Datum > Point > Offset Coordinate System"
4. Create a sketch that connects the dots (points) via splines/lines
5. Save the sketch as copy (.sec file)
6. Create the datum graph by importing the .sec file. You have to set up your csys orientation and origin appropriately.
Apr 17, 2019
01:47 PM
- Mark as New
- Bookmark
- Subscribe
- Mute
- Subscribe to RSS Feed
- Permalink
- Notify Moderator
Apr 17, 2019
01:47 PM
Here is a really nice way to import the points (.pts) and create a curve automatically. This uses Scan tools. I am not sure what Creo packages have this or don't have this.
1. Get Data - Independent Geometry (opens scan tools)
2. Sample Data from file.
3. High Density.
4. Pick a coordinate system to place points.
5. Pick .pts file - Import (Must have at least 32 points!)
6. Can usually do defaults for raw data dialog.
Curve#1 is created but it is not geometry yet.
7. To create Curve#2 choose Curve drop down - "from sample data" - choose curve#1
8. OK scan tools and OK indep. geom. feature.
8. Create sketch and project to use the curve#2 just created and proceed to save sketch and create datum graph feature.
Apr 16, 2019
03:47 PM
- Mark as New
- Bookmark
- Subscribe
- Mute
- Subscribe to RSS Feed
- Permalink
- Notify Moderator
Apr 16, 2019
03:47 PM
Is your study a Simulate analysis or an MDO analysis? There are different approaches based on what tool you're using and what you ultimately would like to understand.
Apr 16, 2019
03:52 PM
- Mark as New
- Bookmark
- Subscribe
- Mute
- Subscribe to RSS Feed
- Permalink
- Notify Moderator
Apr 16, 2019
03:52 PM
It's a simulate analysis. I've created measures in the crankpin fillets. I'm trying to map the max principal stress through a full rotation. Troubleshooting fatigue failures.
Apr 16, 2019
04:01 PM
- Mark as New
- Bookmark
- Subscribe
- Mute
- Subscribe to RSS Feed
- Permalink
- Notify Moderator
Apr 16, 2019
04:01 PM
No problem. I'm glad to help. The hard part is knowing what words to search by, so that is why I didn't just say - "look in the help". Also, note you can drive relations by a c program. That is in help too. I have never done that, but I would love to come up with a reason to try it. 🙂
Apr 16, 2019
04:19 PM
- Mark as New
- Bookmark
- Subscribe
- Mute
- Subscribe to RSS Feed
- Permalink
- Notify Moderator
Apr 16, 2019
04:19 PM
OK, you can create a DOE (MODS study in BMX) and drive the geometry and load (magnitude and direction) to populate your matrix with the values you're looking for. Simulate can have parameters to drive loading that will correspond with your crank rotation angle. This is actually a very simple approach to implement if you have all the load vs crank data already.
Apr 16, 2019
05:08 PM
- Mark as New
- Bookmark
- Subscribe
- Mute
- Subscribe to RSS Feed
- Permalink
- Notify Moderator
Apr 16, 2019
05:08 PM
I think the intention is to run a simulate design sensitivity study not behavior modelling / DOE???
Apr 17, 2019
07:57 AM
- Mark as New
- Bookmark
- Subscribe
- Mute
- Subscribe to RSS Feed
- Permalink
- Notify Moderator
Apr 17, 2019
07:57 AM
The suggestion is to run a DOE, or "Multi-Objective Design Study" (MODS) within "Behavioral Modeling Extension (BMX), and NOT a sensitivity. This is because you need to drive 2 parameters (or more depending on how you specify the loading) into the model as inputs - geometry and load. A sensitivity study only allows one varying input to study many outputs. You can import a text file of your DOE into this tool and define it for one analysis per row of data. The BMX tool is a very significant engineering suite of functions that far too few people know is there (or don't realize what the complete module offers). Unfortunately, it is an add-on module for less expensive licenses/packages of Creo. The problem scoped in this thread is exactly why BMX exists.
BTW - an older version of BMX training (back closer to 2000 if I remember correctly) included a thorough discussion and example of "Graph Matching". This function would not help with this problem. But, the Graph Matching capability is significant for what it can do - monitor a performance output of a system and compare it to a set of data (plot data), and adjust your design until your output responds as close as possible to your input desired plot shape. This is a very cool design engineering capability.
Chris
Apr 17, 2019
11:22 AM
- Mark as New
- Bookmark
- Subscribe
- Mute
- Subscribe to RSS Feed
- Permalink
- Notify Moderator
Apr 17, 2019
11:22 AM
Thanks for this advice. I do have the BMX module as an option. I turned it on but I don't see it anywhere. I see MODS in the Creo environment but not in the Simulate environment. Do I launch it from CREO Parametric or Simulate? Do you have a link you can share to point me in the right direction?
The sensitivity analysis is working, but it is cumbersome to analyze the data. Is it possible to output all the resulting measures for all steps as a csv?
Apr 17, 2019
03:32 PM
- Mark as New
- Bookmark
- Subscribe
- Mute
- Subscribe to RSS Feed
- Permalink
- Notify Moderator
Apr 17, 2019
03:32 PM
What you need to do first is create a Simulate analysis that will run using the parameter(s) you establish to drive the load. Then, while still in Simulate, create a measure that will capture the result you wish to evaluate for each crank angle (stress, strain, etc.). Once this is done, you go back to Creo and create a "Simulate Analysis" feature. When you do this, BMX will then have all the information it needs to organize and run a MODS where Simulate is actually executed for every combination of crank angle and its associated load on the crank (the table you provide). While you are creating the MODS, you'll have access to the output measure(s) you created in the Simulate analysis feature. Select the parameters you wish to drive and import the table of values for your geometry and load combinations.
I know it sounds a bit complicated, but it really is very simple to construct. I'd need to dig a bit to find a good Internet reference for this effort - typical BMX training should cover these steps.
Apr 17, 2019
04:33 PM
- Mark as New
- Bookmark
- Subscribe
- Mute
- Subscribe to RSS Feed
- Permalink
- Notify Moderator
Apr 17, 2019
04:33 PM
Regarding CSV of result measures.
Hmmm... Am I missing something here? The only thing you can view for global sensitivity design studies is a graph. Creo simulate graphs can be exported to excel using file save-as.
Apr 17, 2019
04:51 PM
- Mark as New
- Bookmark
- Subscribe
- Mute
- Subscribe to RSS Feed
- Permalink
- Notify Moderator
Apr 17, 2019
04:51 PM

This is what I would do for every 1 degree from 0 to 360 degrees.
d12 is your assembly angle dimension.
Apr 18, 2019
11:19 AM
- Mark as New
- Bookmark
- Subscribe
- Mute
- Subscribe to RSS Feed
- Permalink
- Notify Moderator
Apr 18, 2019
11:19 AM
This is what I did and it worked well.
Apr 18, 2019
11:48 AM
- Mark as New
- Bookmark
- Subscribe
- Mute
- Subscribe to RSS Feed
- Permalink
- Notify Moderator
Apr 18, 2019
11:48 AM
Are there images not showing in your response? It would be nice to see what you did.
By 200+ points are you talking about your graph datum for the force magnitude or do you have 200+ analysis measures at 200+ different 3d points you are tracking stress at?
Apr 18, 2019
02:14 PM
- Mark as New
- Bookmark
- Subscribe
- Mute
- Subscribe to RSS Feed
- Permalink
- Notify Moderator
Apr 18, 2019
02:14 PM
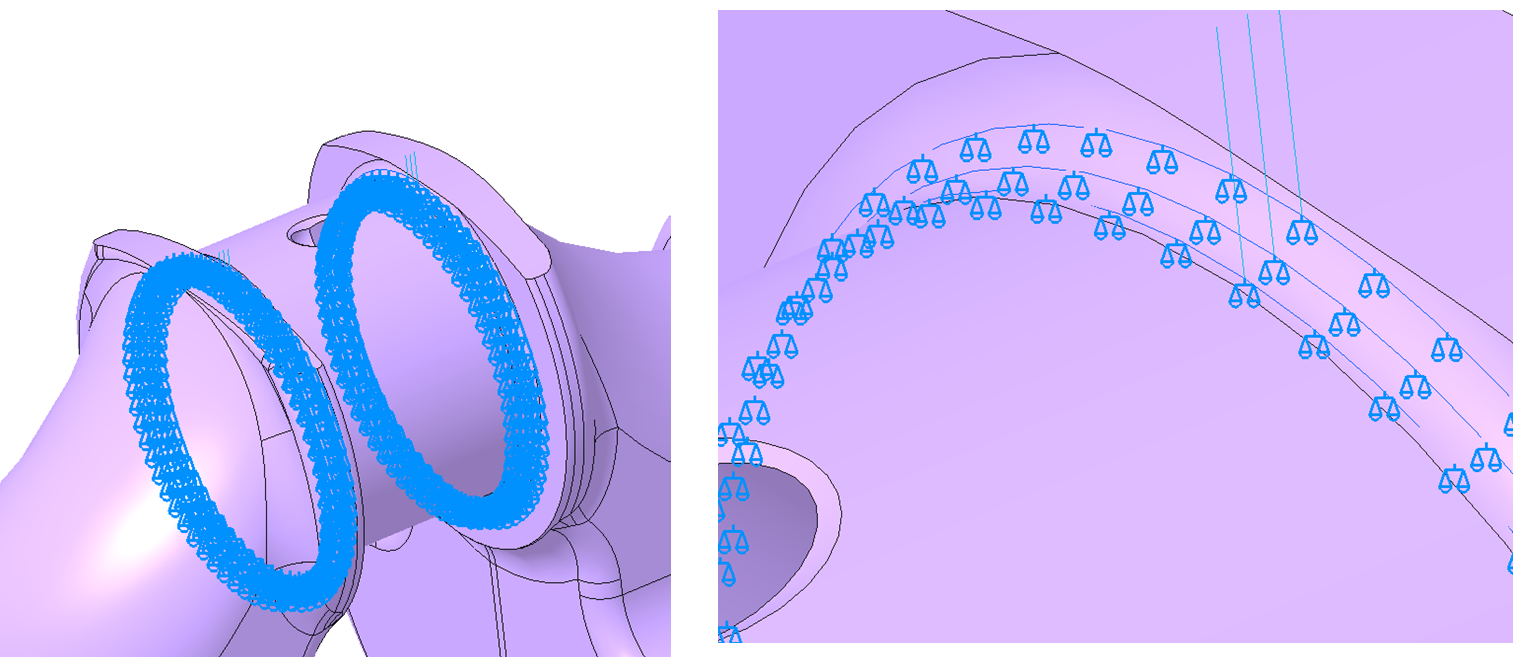
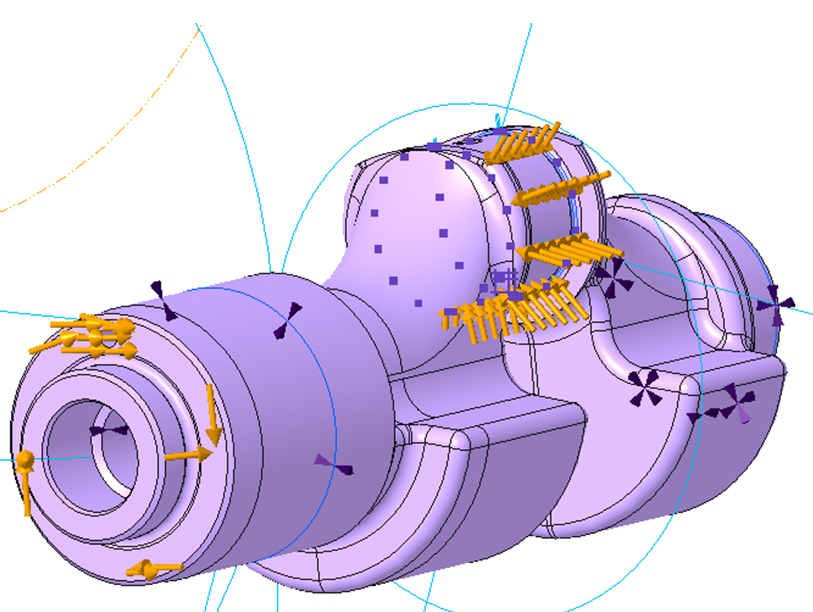
Here are some photos showing the loads and constraints, the graphs and relations and the measures I used.
Apr 22, 2019
03:49 PM
- Mark as New
- Bookmark
- Subscribe
- Mute
- Subscribe to RSS Feed
- Permalink
- Notify Moderator
Apr 22, 2019
03:49 PM
Here is a procedure to obtain all those 200+ measures in an Excel format.
You will find your measures in a study subfolder as a text file with .g01 extension.
You can open this with notepad to view contents.
The format is not ideal for Excel plotting so it needs to be parsed into a better format.
Here is my parsing method. Use whatever programming language you prefer, some have built-in reshaping of matrices so that step will be easier. I see now someone also posted a generic reshape function for MathCAD here.
1. copy and rename the g01 file to have .txt extension
2. import to Excel using space as delimiter.
3. save as xlsx.
4. Use MathCad parser below, Note: uses fully licensed version of MathCad Prime 5


Apr 23, 2019
04:50 PM
- Mark as New
- Bookmark
- Subscribe
- Mute
- Subscribe to RSS Feed
- Permalink
- Notify Moderator

Apr 23, 2019
04:55 PM
- Mark as New
- Bookmark
- Subscribe
- Mute
- Subscribe to RSS Feed
- Permalink
- Notify Moderator
Apr 23, 2019
04:55 PM
That looks powerful. I basically did steps 1-3 and then used index functions within excel to accomplish it. Creo really should be able to output this data in a more useful manner.
Apr 30, 2019
12:34 PM
- Mark as New
- Bookmark
- Subscribe
- Mute
- Subscribe to RSS Feed
- Permalink
- Notify Moderator
Apr 30, 2019
12:34 PM
Is it possible to save the parser file so it is compatible with MathCad Prime 4?
My .g01 file is from a sensitivity study. I have 360 measures for max principal stress on the crankpin fillets for a crankshaft. The study is measuring this data for every 6 degrees of crankangle rotation. Would your parser work for this or would it require changes.
My goal is to create contour maps of the stresses. I've completed some of it (see photo). But it's time consuming and Excel has limited capability when it comes to contour plots. I'd like to find a better way

Apr 18, 2019
11:19 AM
- Mark as New
- Bookmark
- Subscribe
- Mute
- Subscribe to RSS Feed
- Permalink
- Notify Moderator
Apr 18, 2019
11:19 AM
That works 1 point at a time. I have 200+ points.
Apr 17, 2019
02:08 AM
- Mark as New
- Bookmark
- Subscribe
- Mute
- Subscribe to RSS Feed
- Permalink
- Notify Moderator
Apr 17, 2019
02:08 AM
Hi, could you post the assembly and/or some pics?
Announcements
Top Tags
