Community Tip - You can Bookmark boards, posts or articles that you'd like to access again easily! X
- Community
- Creo+ and Creo Parametric
- System Administration, Installation, and Licensing topics
- Re: Interpretation of Gadget: Average Number Of Se...
- Subscribe to RSS Feed
- Mark Topic as New
- Mark Topic as Read
- Float this Topic for Current User
- Bookmark
- Subscribe
- Mute
- Printer Friendly Page
Interpretation of Gadget: Average Number Of Sessions Per User Per Day - In Days
- Mark as New
- Bookmark
- Subscribe
- Mute
- Subscribe to RSS Feed
- Permalink
- Notify Moderator
Interpretation of Gadget: Average Number Of Sessions Per User Per Day - In Days
Hello eveyone,
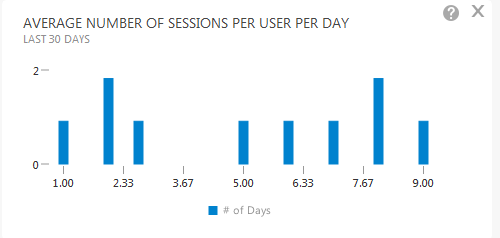
Is anyone using this gadget Average Number of Sessions Per User Per Day

I find it difficult to interpret. Does it mean:
There was one day where there was only one session and at the other end there was 1 day where there was 9 sessions? What would be a good value 1? Because higher than one means they restarted Creo for some reason?
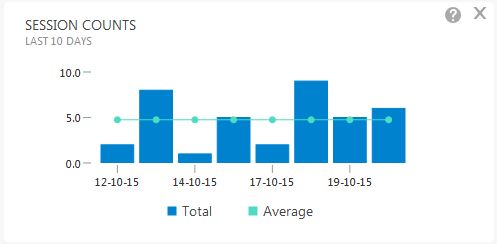
I think I expect to read it with the horizontal axis being a historical rolling view like the Session Counts gadget.

But then it would mean Average Number of Sessions Per User Per Day would be the same as Session Counts. So I'm thinking the problem is in my interpretation of Average Number of Sessions Per User Per Day.
Curious as to others thoughts and experience with this.
Best regards.
- Labels:
-
Performance Advisor
- Mark as New
- Bookmark
- Subscribe
- Mute
- Subscribe to RSS Feed
- Permalink
- Notify Moderator
Hello Jim,
Sorry, I somehow missed this thread before.
Other users are similarly confused about this diagram and one opened a case with us today.
We found your thread now when searching for similar requests.
What I understand of the diagram is this:
- The average numbers for the last 30 days are grouped into different number ranges on the horizontal axis
- The number of days that fall into a group are shown as bar height (scale on the vertical axis)
I reported SPR 5164647 to our development for two things:
- To provide a documentation under the Help link (there is none)
- To clarify details and purpose of the diagram (yes, I had also expected the time line on the horizontal axis)
For reference, see article CS228297
Regards,
Gunter
- Mark as New
- Bookmark
- Subscribe
- Mute
- Subscribe to RSS Feed
- Permalink
- Notify Moderator
Hello Gunter,
Good stuff! More great engagement from the PTC support and development team. Awesome work. Thanks again.
P.S. PTC Support is 10^9 better than Apple support!
- Jim


