- Community
- ThingWorx
- ThingWorx Developers
- Re: Plotting Limit Lines on Chart
- Subscribe to RSS Feed
- Mark Topic as New
- Mark Topic as Read
- Float this Topic for Current User
- Bookmark
- Subscribe
- Mute
- Printer Friendly Page
Plotting Limit Lines on Chart
- Mark as New
- Bookmark
- Subscribe
- Mute
- Subscribe to RSS Feed
- Permalink
- Notify Moderator
Plotting Limit Lines on Chart
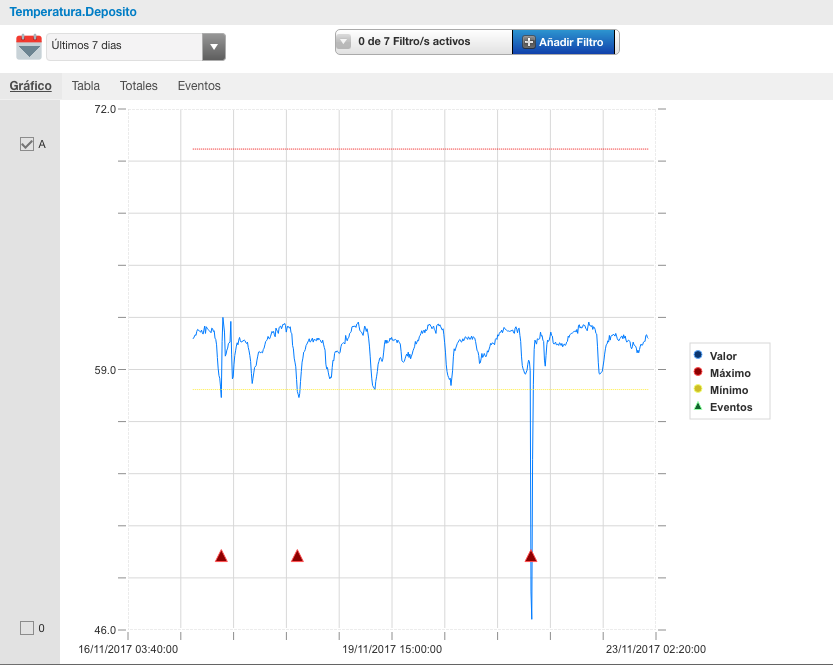
I've plotted data into a Time Series Chart widget. I need to be able to overlay horizontal lines on the same chart to show limits that the data should be over/under.
Is this possible with the regular time series chart widget or is there an extension widget that can accomplish this? I'm working with Thingworx 7.1 right now.
Solved! Go to Solution.
- Labels:
-
Mashup-Widget
Accepted Solutions
- Mark as New
- Bookmark
- Subscribe
- Mute
- Subscribe to RSS Feed
- Permalink
- Notify Moderator
As a workaround, you can add two new time series fake data which are the Upper and Lower limits, we already did it:

- Mark as New
- Bookmark
- Subscribe
- Mute
- Subscribe to RSS Feed
- Permalink
- Notify Moderator
Unfortunately, this is a customization. You will need to modify the out of the box chart widget to accept the upper and lower x values for your line start/end and then draw those lines on new blank canvas that overlays the chart widget. Or use a different chart library that offers this functionality, pass in the required data, and let the library handle the rendering.
- Mark as New
- Bookmark
- Subscribe
- Mute
- Subscribe to RSS Feed
- Permalink
- Notify Moderator
As a workaround, you can add two new time series fake data which are the Upper and Lower limits, we already did it:

- Mark as New
- Bookmark
- Subscribe
- Mute
- Subscribe to RSS Feed
- Permalink
- Notify Moderator
I'll mention what I ended up actually doing in case it helps someone else:
I already had a "helper" Thing created for services I needed to write. I wrote a simple service to get the first and last entries in my InfoTable (ordered by time stamp) and create a 2 row Info Table containing these times with the same limit Number value. Plotting this Info Table in a Time Series Chart gives a horizontal line at the y-value limit (as long as you have the Chart type set up for a Line). I also edited the Styles of the pens to give a dotted or dashed line.
- Mark as New
- Bookmark
- Subscribe
- Mute
- Subscribe to RSS Feed
- Permalink
- Notify Moderator
Probably a bit late, but DeriveFields is perfect for creating these additional series.


