Community Tip - Have a PTC product question you need answered fast? Chances are someone has asked it before. Learn about the community search. X
- Community
- Augmented Reality
- Vuforia Studio
- FEM analysis in Vuforia studio
- Subscribe to RSS Feed
- Mark Topic as New
- Mark Topic as Read
- Float this Topic for Current User
- Bookmark
- Subscribe
- Mute
- Printer Friendly Page
FEM analysis in Vuforia studio
- Mark as New
- Bookmark
- Subscribe
- Mute
- Subscribe to RSS Feed
- Permalink
- Notify Moderator
FEM analysis in Vuforia studio
Hi,
In the same way as adding streamlines from Creo Flow Analysis(https://community.ptc.com/t5/Studio/How-to-add-streamlines-from-Creo-Flow-Analysis/m-p/563464 Where the streamlines are exported from Creo Flow Analysis), I wonder if it is possible to do the same with structural analysis. E.g FEM visualization in Vuforia studio. (Like this: https://www.youtube.com/watch?v=5ACqirpuxvk).
I would like to visualize the structural analysis using AR.
Cheers,
Martin
Solved! Go to Solution.
Accepted Solutions
- Mark as New
- Bookmark
- Subscribe
- Mute
- Subscribe to RSS Feed
- Permalink
- Notify Moderator
Hi @lundha,
one thing I tested is the result of static analysis with Creo Simulate. The previous name was Creo Mechanica - the engine is not ANSYIS but the results windows used the same functionality - so I think also an ANSYS results could be display on the same way
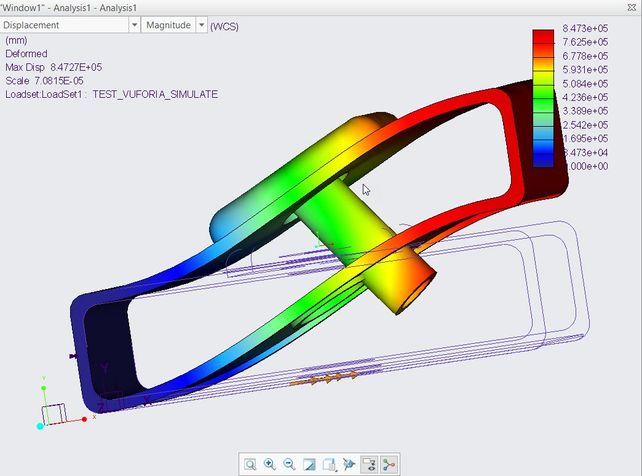
For Creo Simulate static analysis then we could have the following resutls
So we can save the results to *.pvs format . This will save a pvs and ol file. We can create a zip file containing both and rename the extension to pvz. Then we can import the pvz result file:
As shown on the picture we can display a color plot and deformation state.
I tested if a Creo Static large deformation analysis with custom interval could be imported. These results could be shown in the Creo Simulate results windows as animation:
Creo Simulate Large def result - Test YouTube
So, the analysis definition I tested in Creo Simulate should looks like:
Then we can set in the result windows definition the output interval what we want to display - means the force here will vary from 0 -100%
We can export different steps and *.pvs + *.ol and then we can show in Vuforia Studio different steps (here I used 2 different model widget but we can also set the model source property of the same model widget e.g. javaScript
Unfortunately, I did not get it working as continuous animation yet. But if I create to many steps – e.g. 100 steps (this will require very long calculation) – in this case I will have to export 100 different models (pvz) and then I could switch between them in the model widget via JavaScript this will looks like a continuous animation, I hope
- Mark as New
- Bookmark
- Subscribe
- Mute
- Subscribe to RSS Feed
- Permalink
- Notify Moderator
Thank you.
This seem managable if Im able to create all the steps, next part would be to play the animation on the HoloLens.


