Community Tip - Visit the PTCooler (the community lounge) to get to know your fellow community members and check out some of Dale's Friday Humor posts! X
- Subscribe to RSS Feed
- Mark as New
- Mark as Read
- Bookmark
- Subscribe
- Printer Friendly Page
- Notify Moderator
ThingWorx Monitoring and Alerting: Using Prometheus and Grafana, Part 1
ThingWorx Monitoring and Alerting, Part 1
Using Prometheus and Grafana
By Tori Firewind, IoT EDC
Introduction and Getting Started
As ThingWorx has become a more mature product during the lifetime of the IoT EDC, so too have our dev ops recommendations. As we’ve stated throughout many posts now, testing is a key part of ensuring enterprise readiness, and it occurs at every stage of the process: from unit testing to preserve individual service logic, to integration tests which preserve the functionality of the application as a whole, to user and edge load testing and user experience testing, which ensure enterprise readiness. So testing is a critical component, but the process of dev ops never stops. In order to effectively test the system, a comprehensive monitoring solution is also required.
Once the application is tested and the changes pushed into production, there is no knowing with certainty that everything will run smoothly indefinitely. Random spikes in usage, server bandwidth or availability, any unforeseeable factors like these can come along and cause issues for a system. If these issues aren’t detected and addressed early, then they can very rapidly morph into much larger problems: outages, data loss, inflated data tables which are hard to revert due to their size. It is critical to detect performance issues on a system as early as possible, to have as much information as is necessary to figure out where the problem is heading, and what may have started it. Monitoring is key to a healthy system.

In a fully mature dev ops pipeline, issues are anticipated, discovered and researched before they become production outages or critical issues. These investigations or testing follow-ups produce development tasks (usually bugs, but also features at times) which then start the dev ops cycle all over again. This is why a good, efficient dev ops pipeline is needed, one which allows changes to quickly and safely go from development to production.
This is also why diagnostic tools play a role in the monitoring piece of the dev ops process. They are the bridge between monitoring and planning. Tools like Dynatrace can be configured to provide call stacks and take thread dumps when issues start to occur, before the system is performing so poorly it needs a restart, which happens automatically in a cluster and can clear out any trace of the issue.
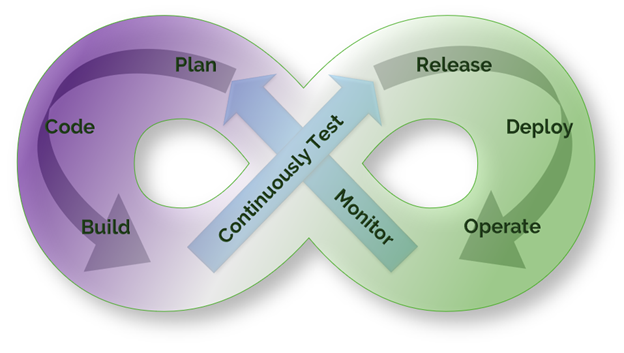
Thread dumps are often necessary to diagnosing the root cause of the issue (to permanently fix it), and doing so quickly ensures application stability and availability. That is, after all, the purpose of the dev ops process. Diagnostics is therefore an equally important piece of the dev ops Figure-8-shaped pie, and one which deserves its own spotlight in an article to come.
Every piece of the dev ops process must be viewed as equally important in its own way, lest the dev ops cycle get hung up on bottlenecks of its own. A safe and stable system is not one which never experiences issues, it is one which has a good, efficient plan in place to handle recovery and prevention of repetition. A wholesome dev ops process is a happy dev ops process.
The Monitoring Stack
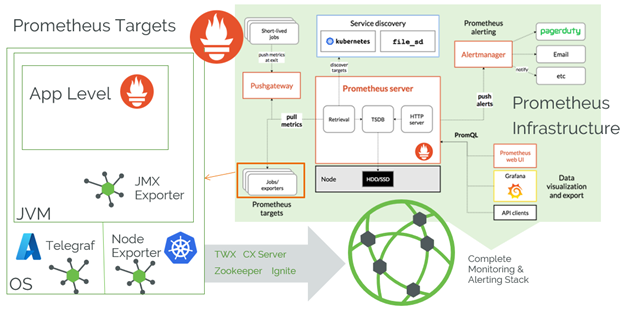
There are many monitoring options available, but in our experience one of the easiest and most effective monitoring stacks to use with ThingWorx is Prometheus for metrics gathering with Grafana for metrics analysis and review. In a mature monitoring stack, Telegraf is also commonly installed on each VM/host to gather the system metrics (like CPU and Memory usage, things we’ve stated are good metrics of system performance and stability in past articles on scale and size testing) and output them in Prometheus format.
Prometheus is a highly scalable open-source monitoring framework that contains out of the box monitoring and alert capabilities for Kubernetes-based deployments (not covered in this article). Using Prometheus is very simple because the ThingWorx application exposes a metrics endpoint which is formatted directly for use by Prometheus. There is also built-in alerting in Prometheus, but not the ability to form dashboards for reviewing data or screenshotting it for documentation purposes. That’s where Grafana comes into play. Grafana has a preconfigured Prometheus-type data source and many preconfigured dashboard templates for various applications and services. Telegraf is also easily imported into Grafana, as is shown in the section below.
Once Prometheus is scraping the targets, alerting on them can be done with OOTB Prometheus functionality, and dashboards for monitoring can be made easily in Grafana (with built-in support as well). This stack does not include the diagnostics piece, something which triggers thread dumps or the like when issues do occur. There are too many ways to conduct a successful diagnostic piece to cover here.
How to Get Started
Getting started monitoring a ThingWorx application is incredibly easy in the latest versions. Simply open up a browser, and type in the ThingWorx URL, followed by “/Metrics”. At this endpoint, there is a specially formatted response that can automatically be read by the Prometheus monitoring software which contains subsystem and service data. In addition to the application metrics, Prometheus can be configured to collect metrics from a node exporter at the (virtualized) operating system or container (Kubernetes) level as well.
If you haven’t already, install Grafana, install Telegraf as a service, and install Docker Desktop. These are the tools required (in addition to ThingWorx of course) to set-up a simple sandbox system for familiarization with the monitoring stack recommended by PTC. The easiest way to try Prometheus on a local Windows instance is to use Docker. The command for that will be found below, but first open up Docker Desktop to set contextual parameters that the command line will need.
Then, modify the configuration file for Telegraf or create one (called telegraf.conf in the same folder as the exe file), and put the following into the file (or uncomment it; the default config file has thousands of lines, so just search for “prometheus”):
Output plugin
[[outputs.prometheus_client]]
listen = "0.0.0.0:9125"
Alternatively, install the Prometheus Node Exporter tool, which will likely require some additions to the Prometheus config file (not covered here) which we are about to create.
Then, create a configuration file (called prom_config_localhost_scraper.yml in the command to come), add the following (assuming a standard localhost installation of ThingWorx):
# my global config
global:
  scrape_interval: 45s
  evaluation_interval: 30s
  scrape_timeout: 30s
  # scrape_timeout is set to the global default (10s).

rule_files:
  - prom_config_rules.yml

scrape_configs:
  - job_name: thingworx
    static_configs:
      - targets: ['host.docker.internal:8080']
    basic_auth:
      username: "Administrator"
      password: "admin!123456789"
    metrics_path: /Thingworx/Metrics
    scheme: http
    params:
      x-thingworx-session:
        - "false"

  - job_name: prometheus
    static_configs:
      - targets: ['localhost:9090']

  - job_name: Telegraf
    # If telegraf is installed, grab stats about the local
    # machine by default.
    static_configs:
      - targets: ['host.docker.internal:9125']
This example script file uses the host.docker.internal instead of localhost for the server target for ThingWorx because it is running outside of the Docker container which contains Prometheus. This yml file configures Prometheus to monitor both ThingWorx and itself, as well as the server metrics coming from Telegraf (as long as they are configured to push). It’s a sandbox-only configuration, really, as you wouldn’t want to use the Administrator user, or have the password printed in plain text in the config file in a real system. Also note the need for the x-thingworx-session parameter, as runaway sessions which spawn every 30s or so (whatever the scrape interval is) will result in memory issues over time (so we don’t want to use sessions here).
The rules file given here (prom_config_rules.yml) needs to be created separately. This is where all of the alert rules will be defined. This will determine if an alert state is happening, but without configuring the alert manager, there won’t be any notification. That isn’t covered here but is covered extensively in the Grafana docs. Here is an alert example:
groups:
- name: alert.rules
  rules:

  # Alert for any instance that is unreachable for >5 minutes.
  - alert: HighMemory
    expr: mem_used > 14000000
    for: 1s
    labels:
      severity: page
    annotations:
      summary: "High Memory"
      description: "Localhost Memory Usage is High"
Now, save these files and use Powershell to run the Docker container:
docker run -p 9090:9090 -v C:\<path_to_document>\prom_config_localhost_scraper.yml:/etc/prometheus/prometheus.yml prom/prometheus
It should download Prometheus and install it in that container (if this is the first time), allowing you to very rapidly deploy it to an endpoint of localhost:9090 by default. If there is an error like the one shown below, this means that you forgot to start Docker Desktop (the application) before opening Powershell.

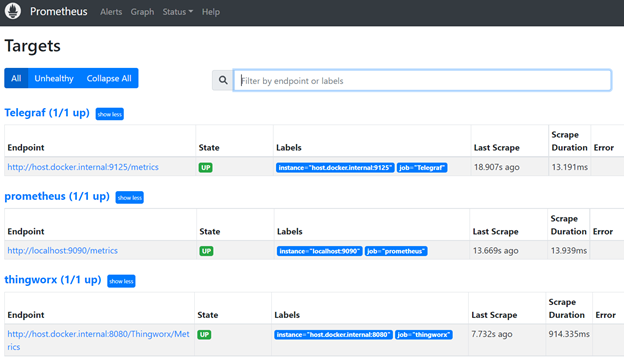
The localhost endpoints are accessible in a browser. ThingWorx defaults to localhost:8080 endpoint. Prometheus defaults to localhost:9090. Telegraf is on port 9125. Open any of these in a browser tab to see the full monitoring stack. You can see easily if Prometheus is working by clicking “Status” > “Targets” at localhost:9090:
If all of the targets appear as blue and say “last scrape” and a time stamp, then they’re working as expected. If they don’t, ensure you have the right ports, that there aren’t any firewall issues (if things aren’t all on localhost), and that everything is running without errors.
The last step in the process here is to install a dashboard tool like Grafana. Once this is installed and running on localhost:3000 (by default), you can display the data from Prometheus with a few configuration steps the Grafana UI. Highlight over the settings icon in the bottom left of the screen, and then click on “Data sources”. Select the “Add data source” button, and then click on Prometheus. You have to type the URL again


