
Turn on suggestions
Auto-suggest helps you quickly narrow down your search results by suggesting possible matches as you type.
Showing results for
Turn on suggestions
Auto-suggest helps you quickly narrow down your search results by suggesting possible matches as you type.
Showing results for
Community Tip - Your Friends List is a way to easily have access to the community members that you interact with the most! X
Options
- Subscribe to RSS Feed
- Mark Topic as New
- Mark Topic as Read
- Float this Topic for Current User
- Bookmark
- Subscribe
- Mute
- Printer Friendly Page
How to use mathcad draw the 3D picture
Mar 21, 2013
10:15 AM
- Mark as New
- Bookmark
- Subscribe
- Mute
- Subscribe to RSS Feed
- Permalink
- Notify Moderator
Mar 21, 2013
10:15 AM
How to use mathcad draw the 3D picture
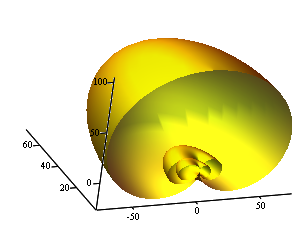
How to use mathcad can draw zhe 3D picture like this
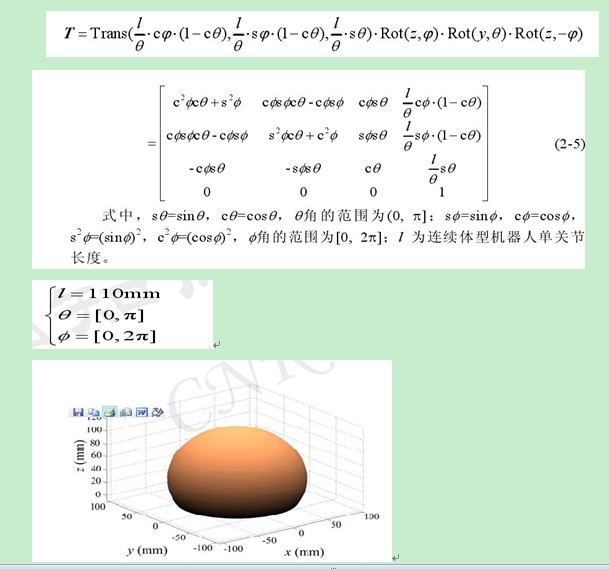
my work is in the attachment , but there is something wrong,who can help me use mathcad draw the 3D picture (the matrix used is shown)
Solved! Go to Solution.
Labels:
- Labels:
-
Other
1 ACCEPTED SOLUTION
Accepted Solutions
Mar 21, 2013
10:48 AM
- Mark as New
- Bookmark
- Subscribe
- Mute
- Subscribe to RSS Feed
- Permalink
- Notify Moderator
Mar 21, 2013
10:48 AM
T seems to be a transformation matrix for affine and projective geometry (therefore 4-dimensional) which is nothing to be plotted.
What are we supposed to see in the picture?
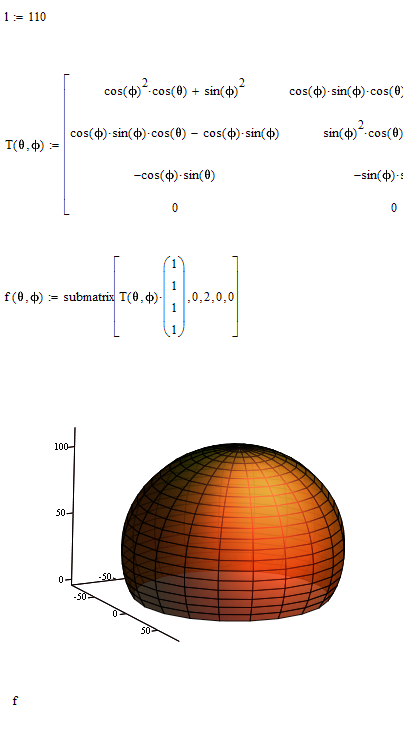
As a (very) quick hack I graphed the transforms of the vector (1,1,1) and set the limits of the angles as quickplot parameters. Not that nice, i know.
7 REPLIES 7
Mar 21, 2013
10:48 AM
- Mark as New
- Bookmark
- Subscribe
- Mute
- Subscribe to RSS Feed
- Permalink
- Notify Moderator
Mar 21, 2013
10:48 AM
T seems to be a transformation matrix for affine and projective geometry (therefore 4-dimensional) which is nothing to be plotted.
What are we supposed to see in the picture?
As a (very) quick hack I graphed the transforms of the vector (1,1,1) and set the limits of the angles as quickplot parameters. Not that nice, i know.
Mar 22, 2013
04:18 AM
- Mark as New
- Bookmark
- Subscribe
- Mute
- Subscribe to RSS Feed
- Permalink
- Notify Moderator
Mar 22, 2013
04:18 AM
thank you very much!!!!!
Mar 22, 2013
04:43 AM
- Mark as New
- Bookmark
- Subscribe
- Mute
- Subscribe to RSS Feed
- Permalink
- Notify Moderator
Mar 22, 2013
04:43 AM
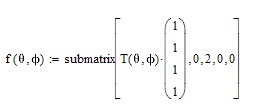
But can you tell me in detail what is meaning of this fuction f() and (0,2,0,0) :
 and how to use the scope of
 angle
I am not clear ,please teach me, thank you ~
Mar 22, 2013
05:13 AM
- Mark as New
- Bookmark
- Subscribe
- Mute
- Subscribe to RSS Feed
- Permalink
- Notify Moderator
Mar 22, 2013
05:13 AM
The matrix which is calculated by function T is, as I guess, a transformation matrix, Its 4x4 so its for projective coordinates. The fourth components of such coordinates can be seen as sort of scaling factor (usually beeing 1). So a point (3,4,5) would be represented by (3,4,5,1). The advantage is that points at infinity can be handles as well with those kind of coordinates, the last component would be 0 then. So to transform a (4-dim) point you would multiply that 4x4 matrix with the 4x1 vector representing the point and the result would again be a 4x1 vector. 3D-plot in Mathcad needs (among other possibilities) a 2-variable-function which returns 3x1 vectors. So thats the way f() is constructed. It applies the transformation to point (1,1,1) and then returns a vector consisting of the first three components of the resulting 4x1 vector (done using submatrix).
I have no idea if applying the transform to (1,1,1) for all possible combinations of theta and Phi makes any sense if if ist that what we see in the picture ypu provided.
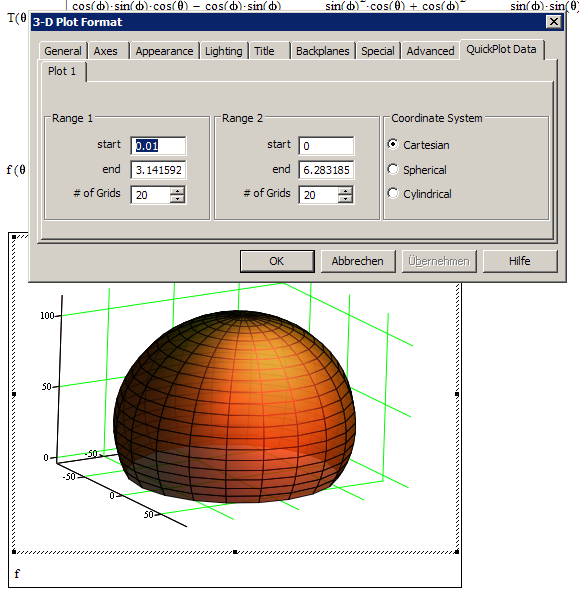
Edit:Forgot to explain how to limit the angle ranges. If you select the plot and go to menu Format/Graph/3DPlot (or simply double click the plot) you enter the Format menu where you can change a lot of settings (I played around with light and transparency, too). To limit the range select tab "Quickplot Data" where you can select the range for the two function parameters (default is -5 to 5) - you can use "pi" or "2*pi" in those fields. You may also increase the # of Grids for a fines mesh. Note that theta is not allowed to be 0, so I let it start at 0.01.
Mar 22, 2013
10:49 AM
- Mark as New
- Bookmark
- Subscribe
- Mute
- Subscribe to RSS Feed
- Permalink
- Notify Moderator
Mar 22, 2013
10:49 AM
thank you very much ~~ I nearly know how the matrix is coming ,so I amend the matrix like you tell me like this ,but I find the length of L has no relation with the 3d plot ,i do not know why, also your program is ok ,i do not know the diffenece between two program
Mar 22, 2013
11:29 AM
- Mark as New
- Bookmark
- Subscribe
- Mute
- Subscribe to RSS Feed
- Permalink
- Notify Moderator
Mar 22, 2013
11:29 AM
,but I find the length of L has no relation with the 3d plot ,i do not know why,
It has an effect, set it to 0.1 for example and see the difference. With larger values of L you can't see much difference unless you look at the axis scales.
This is because Mathcad defaults to autoscaling. You can change this in the Format menu under tab "axes".
BTW, intersting if you let run Phi from 0 to only pi to look inside and let theta run from 0.001 to, lets say, 6*pi or higher.
Mar 22, 2013
07:41 PM
- Mark as New
- Bookmark
- Subscribe
- Mute
- Subscribe to RSS Feed
- Permalink
- Notify Moderator
Mar 22, 2013
07:41 PM
ok thank you very much ,i am a new mathcad user ,so there are so many question to ask you .thank you for your teaching~~

