
Turn on suggestions
Auto-suggest helps you quickly narrow down your search results by suggesting possible matches as you type.
Showing results for
Turn on suggestions
Auto-suggest helps you quickly narrow down your search results by suggesting possible matches as you type.
Showing results for
Community Tip - Did you get an answer that solved your problem? Please mark it as an Accepted Solution so others with the same problem can find the answer easily. X
Options
- Subscribe to RSS Feed
- Mark Topic as New
- Mark Topic as Read
- Float this Topic for Current User
- Bookmark
- Subscribe
- Mute
- Printer Friendly Page
Not show valu plot
Oct 07, 2012
11:24 AM
- Mark as New
- Bookmark
- Subscribe
- Mute
- Subscribe to RSS Feed
- Permalink
- Notify Moderator
Oct 07, 2012
11:24 AM
Not show valu plot
Labels:
- Labels:
-
Other
1 ACCEPTED SOLUTION
Accepted Solutions
Oct 07, 2012
01:47 PM
- Mark as New
- Bookmark
- Subscribe
- Mute
- Subscribe to RSS Feed
- Permalink
- Notify Moderator
Oct 07, 2012
01:47 PM
dongchi 420 wrote:
Hi all,
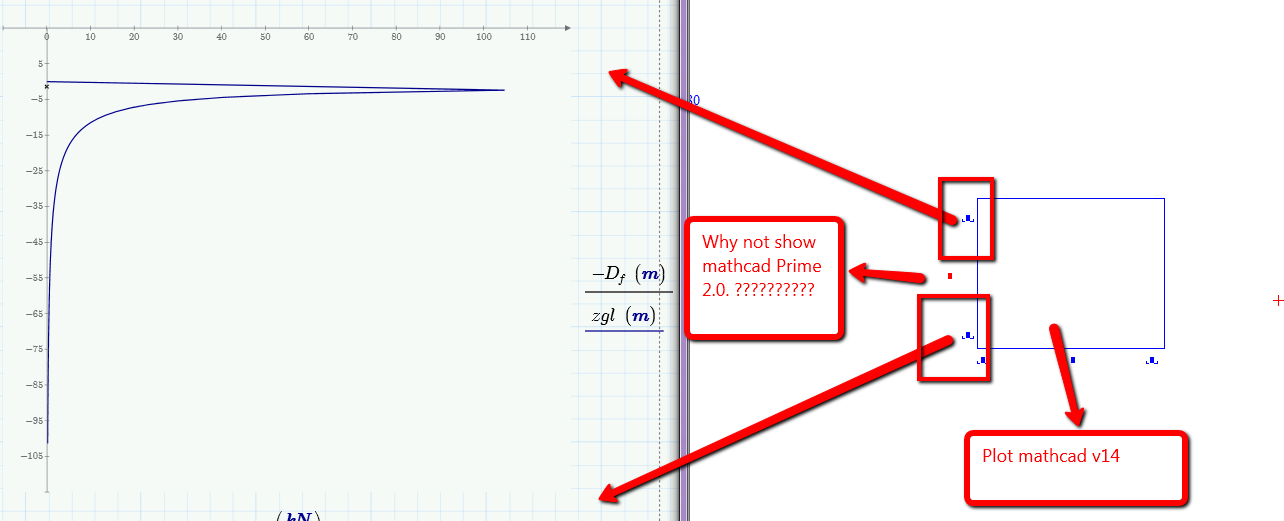
Why mathcad prime not show plot same plot mathcad v14.???
THanks
It's actually more flexible in some resects.
If you want the trace label on the left, just click on it and drag it there (you should see a placeholder appear for it).
If you want the x-axis at the bottom, just click on the axis and drag it to where you want it.
If you want to change the limits, just click on the max or min value and edit it to be what you want.
Stuart
2 REPLIES 2
Oct 07, 2012
01:47 PM
- Mark as New
- Bookmark
- Subscribe
- Mute
- Subscribe to RSS Feed
- Permalink
- Notify Moderator
Oct 07, 2012
01:47 PM
dongchi 420 wrote:
Hi all,
Why mathcad prime not show plot same plot mathcad v14.???
THanks
It's actually more flexible in some resects.
If you want the trace label on the left, just click on it and drag it there (you should see a placeholder appear for it).
If you want the x-axis at the bottom, just click on the axis and drag it to where you want it.
If you want to change the limits, just click on the max or min value and edit it to be what you want.
Stuart
Oct 07, 2012
10:12 PM
- Mark as New
- Bookmark
- Subscribe
- Mute
- Subscribe to RSS Feed
- Permalink
- Notify Moderator
Oct 07, 2012
10:12 PM
Oh yes. Thank Stuart.

