
Turn on suggestions
Auto-suggest helps you quickly narrow down your search results by suggesting possible matches as you type.
Showing results for
Turn on suggestions
Auto-suggest helps you quickly narrow down your search results by suggesting possible matches as you type.
Showing results for
Community Tip - You can change your system assigned username to something more personal in your community settings. X
Options
- Subscribe to RSS Feed
- Mark Topic as New
- Mark Topic as Read
- Float this Topic for Current User
- Bookmark
- Subscribe
- Mute
- Printer Friendly Page
Plotting graph using excel data in Mathcad 15 M050
Apr 04, 2024
08:30 AM
- Mark as New
- Bookmark
- Subscribe
- Mute
- Subscribe to RSS Feed
- Permalink
- Notify Moderator
Apr 04, 2024
08:30 AM
Plotting graph using excel data in Mathcad 15 M050
hello, I would like some help with: I inserted the text file, but I don't have a graphic.
thank you very much in advance
Translated by the Community Moderation using Google Translate
-----------------------------------------------------------------------------------------------
bonjour, je souhaite obtenir de l'aide concernant : J'ai inséré le fichier texte, mais je n'ai pas de graphique.
Merci beaucoup d'avance
Solved! Go to Solution.
Labels:
- Labels:
-
Mathcad Usage
1 ACCEPTED SOLUTION
Accepted Solutions
Apr 04, 2024
09:09 AM
- Mark as New
- Bookmark
- Subscribe
- Mute
- Subscribe to RSS Feed
- Permalink
- Notify Moderator
Apr 04, 2024
09:09 AM
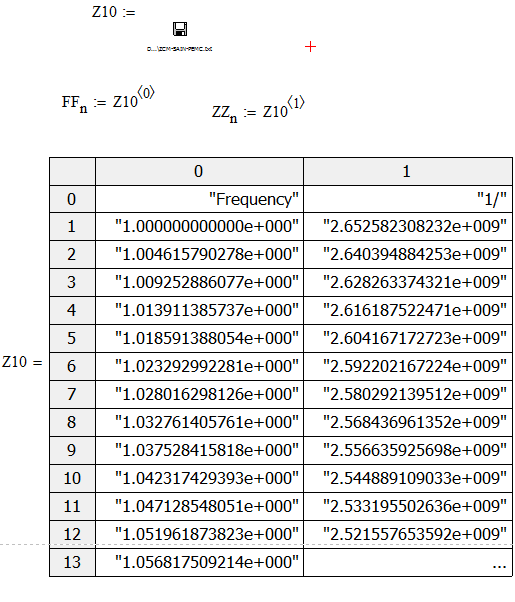
The "values" of your imported data actually are not numbers but rather text strings (you can tell by the quotes around them). Thats the reason why your plot attempt fails.
Can you post the Mathcad sheet and the excel file for examination?
EDIT: Ahh, I see that Terry has beaten me for four minutes 😉
Actually the header strings would not result in an error in a 2D plot, they simply would be ignored.
The error occurs because all "data" are strings.
Nonetheless, I would consider it good habit to get rid of the columns labels and just work with the pure numerical data.
3 REPLIES 3
Apr 04, 2024
09:05 AM
- Mark as New
- Bookmark
- Subscribe
- Mute
- Subscribe to RSS Feed
- Permalink
- Notify Moderator
Apr 04, 2024
09:05 AM
Hi
The headers to the data in row 0 cannot be plotted. Adjust the properties of the data input to start from second row.
The numbers in Z10 are actually text indicated by double quotes.
Upload you xmcd file and the data file so input can be corrected for you.
Les en-têtes des données de la ligne 0 ne peuvent pas être tracés. Ajustez les propriétés de l'entrée de données pour commencer à partir de la deuxième ligne.
Les chiffres dans Z10 sont en fait du texte indiqué par des guillemets doubles.
Téléchargez votre fichier xmcd et le fichier de données afin que la saisie puisse être corrigée pour vous.
Cheers
Terry
Apr 04, 2024
09:09 AM
- Mark as New
- Bookmark
- Subscribe
- Mute
- Subscribe to RSS Feed
- Permalink
- Notify Moderator
Apr 04, 2024
09:09 AM
The "values" of your imported data actually are not numbers but rather text strings (you can tell by the quotes around them). Thats the reason why your plot attempt fails.
Can you post the Mathcad sheet and the excel file for examination?
EDIT: Ahh, I see that Terry has beaten me for four minutes 😉
Actually the header strings would not result in an error in a 2D plot, they simply would be ignored.
The error occurs because all "data" are strings.
Nonetheless, I would consider it good habit to get rid of the columns labels and just work with the pure numerical data.
Apr 05, 2024
06:20 PM
- Mark as New
- Bookmark
- Subscribe
- Mute
- Subscribe to RSS Feed
- Permalink
- Notify Moderator
Apr 05, 2024
06:20 PM
Thanks to your help the problem solved, thank you very much

