
Turn on suggestions
Auto-suggest helps you quickly narrow down your search results by suggesting possible matches as you type.
Showing results for
Please log in to access translation
Turn on suggestions
Auto-suggest helps you quickly narrow down your search results by suggesting possible matches as you type.
Showing results for
Translate the entire conversation x
Please log in to access translation
Options
- Subscribe to RSS Feed
- Mark Topic as New
- Mark Topic as Read
- Float this Topic for Current User
- Bookmark
- Subscribe
- Mute
- Printer Friendly Page
Problem plotting function with range variable
Mar 27, 2013
06:04 PM
- Mark as New
- Bookmark
- Subscribe
- Mute
- Subscribe to RSS Feed
- Permalink
- Notify Moderator
Please log in to access translation
Mar 27, 2013
06:04 PM
Problem plotting function with range variable
I've been using R14 for a while and recently tried switching to Prime to see if it would be a useful upgrade, but I've failed miserably at reproducing some very simple work from R14 (I didn't want to uninstall R14 to put R15 on to do the conversion so I thought I'd try something from scratch).
I would like to plot the result of a simple function across a range, I've declared the function and verified it works but I can't plot it using a range variable for one of the arguments?
It gives me the error "There are too many range variables"...what am I doing wrong?
Solved! Go to Solution.
ACCEPTED SOLUTION
Accepted Solutions
Mar 27, 2013
06:51 PM
- Mark as New
- Bookmark
- Subscribe
- Mute
- Subscribe to RSS Feed
- Permalink
- Notify Moderator
Please log in to access translation
Mar 27, 2013
06:51 PM
Chris Rae wrote:
I've been using R14 for a while and recently tried switching to Prime to see if it would be a useful upgrade,
Not yet, in my opinion.
The error is a funny one and unfortunately not so seldom with Prime.
The error message is nonsense and absolutely not helpful, though.
I recreated the graph in your sheet and it worked immediatly. Finding the error took a bit longer.
Its the theta as argument in the function T.out in the plot. It is formatted (style) as "variable" (as it is above in the declaration above) and if you change it to "none" it works. The other parameters can stay styled as "variable".
It seems to me to be a bug. If I delete the whole function call and retype it, all parameters get style "none" for reasons only PTC will know of, if any.
P.S.: If you want a sheet created in real Mathcad be converted to Prime format, post it here and I am sure, someone will be willing to do the conversion for you.
18 REPLIES 18
Mar 27, 2013
06:51 PM
- Mark as New
- Bookmark
- Subscribe
- Mute
- Subscribe to RSS Feed
- Permalink
- Notify Moderator
Please log in to access translation
Mar 27, 2013
06:51 PM
Chris Rae wrote:
I've been using R14 for a while and recently tried switching to Prime to see if it would be a useful upgrade,
Not yet, in my opinion.
The error is a funny one and unfortunately not so seldom with Prime.
The error message is nonsense and absolutely not helpful, though.
I recreated the graph in your sheet and it worked immediatly. Finding the error took a bit longer.
Its the theta as argument in the function T.out in the plot. It is formatted (style) as "variable" (as it is above in the declaration above) and if you change it to "none" it works. The other parameters can stay styled as "variable".
It seems to me to be a bug. If I delete the whole function call and retype it, all parameters get style "none" for reasons only PTC will know of, if any.
P.S.: If you want a sheet created in real Mathcad be converted to Prime format, post it here and I am sure, someone will be willing to do the conversion for you.
Mar 27, 2013
07:09 PM
- Mark as New
- Bookmark
- Subscribe
- Mute
- Subscribe to RSS Feed
- Permalink
- Notify Moderator
Please log in to access translation
Mar 27, 2013
07:09 PM
Addendum:
A better and more logical way to correct it, is to assign the variable theta on the abscissa the style "variable"!
Mar 27, 2013
07:13 PM
- Mark as New
- Bookmark
- Subscribe
- Mute
- Subscribe to RSS Feed
- Permalink
- Notify Moderator
Please log in to access translation
Mar 27, 2013
07:13 PM
Excellent, thanks for the responses, I can see the issue now, although I'm not sure how it occurred (or why the error message was so uselessly cryptic!). As you suggested I'm not sure this new version is ready for me to make the switch.
Apr 03, 2013
01:47 PM
- Mark as New
- Bookmark
- Subscribe
- Mute
- Subscribe to RSS Feed
- Permalink
- Notify Moderator
Please log in to access translation
Apr 03, 2013
01:47 PM
Hi Werner,
Thanks for the great post here! I am also having the same issue. I tried to apply your suggestion, but in my case, it does not seem to work. I have attached my Mathcad Prime 2.0 file here.
Do you know why I keep getting the message "There are too many range variables?"
Thanks!
Apr 03, 2013
02:31 PM
- Mark as New
- Bookmark
- Subscribe
- Mute
- Subscribe to RSS Feed
- Permalink
- Notify Moderator
Please log in to access translation
Apr 03, 2013
02:31 PM
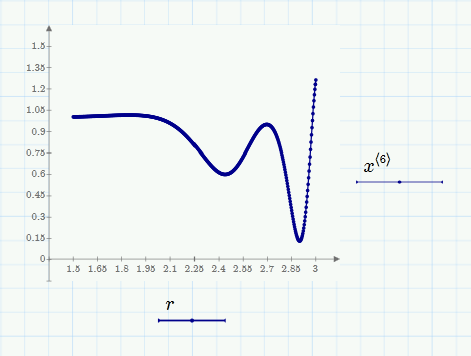
Your x[i,n results in a lot of invalid matrxi indices - dont know why Mathcad is not throwing an error in the evaluation to the right. r is a 301-element vector as so you should have a vector (not a 2-dimensional matrix) of same dimension on the ordinate. For instance a specific column of matrix x.
Apr 03, 2013
04:04 PM
- Mark as New
- Bookmark
- Subscribe
- Mute
- Subscribe to RSS Feed
- Permalink
- Notify Moderator
Please log in to access translation
Apr 03, 2013
04:04 PM
Thanks, Werner. But in the plot you sent me, it is just showing one of the values. I would like to plot all of them. It works in Mathcad 14, but I cannot make it to work in Mathcad Prime.
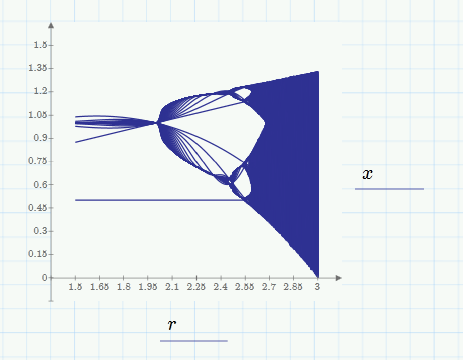
The plot I am trying to make is the bifurcation diagram. Take a look at the first figure on the Wikipedia website at: http://en.wikipedia.org/wiki/Bifurcation_diagram
Apr 03, 2013
04:31 PM
- Mark as New
- Bookmark
- Subscribe
- Mute
- Subscribe to RSS Feed
- Permalink
- Notify Moderator
Please log in to access translation
Apr 03, 2013
04:31 PM
I think you will find some solutions here in the forum, too, if you search for Feigenbaum, bifurcation, etc.
Prime still is a work in progress, Mathcad 14 being far superior. Why would you use Prime voluntarily?
Anyway, in Prime you can simply plot the matrix x over the vector r. You have to change the diagram type to "waterfall plot" to make it work. Also it seems that Prime has a bad upper limit for the number of points it is willing to plot so you will have reduce something in your matrix. Prime is very limited. As a quick hack I have set N to 90 to make it work. I found no way to tell Prime not to connect the points..
You may use submatrix to eliminate the first columns of the matrix x, maybe that helps in using only the higher iterations steps.
Apr 03, 2013
04:51 PM
- Mark as New
- Bookmark
- Subscribe
- Mute
- Subscribe to RSS Feed
- Permalink
- Notify Moderator
Please log in to access translation
Apr 03, 2013
04:51 PM
Thank you so much, Werner! This was very helpful! I agree entirely with you that Prime is limited compared to Mathcad 14 when it comes to this type of plots.
Thanks!
Apr 03, 2013
07:33 PM
- Mark as New
- Bookmark
- Subscribe
- Mute
- Subscribe to RSS Feed
- Permalink
- Notify Moderator
Please log in to access translation
Apr 03, 2013
07:33 PM
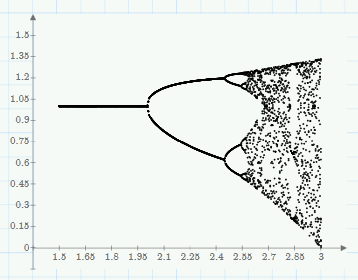
This is better now, but in no way real Mathcad
If we chose to plot more than 5000 (yes, 5k, not 50k) points, Prime will connect them - crazy!
Apr 04, 2013
02:23 AM
- Mark as New
- Bookmark
- Subscribe
- Mute
- Subscribe to RSS Feed
- Permalink
- Notify Moderator
Please log in to access translation
Apr 04, 2013
02:23 AM
Werner, this looks so much better! Thank you so much!
Sep 26, 2022
02:17 AM
- Mark as New
- Bookmark
- Subscribe
- Mute
- Subscribe to RSS Feed
- Permalink
- Notify Moderator
Please log in to access translation
Sep 26, 2022
02:17 AM
Hi. I am trying to setting ranges of variables in plot in ptc v.7.0. But it is really difficult to me. Can you give me some advices? Thank you so much.


Sep 26, 2022
07:13 AM
- Mark as New
- Bookmark
- Subscribe
- Mute
- Subscribe to RSS Feed
- Permalink
- Notify Moderator
Please log in to access translation
Sep 26, 2022
07:13 AM
It is always better in such cases to open a separate new thread with your question 😉
Jan 25, 2023
01:22 PM
- Mark as New
- Bookmark
- Subscribe
- Mute
- Subscribe to RSS Feed
- Permalink
- Notify Moderator
Please log in to access translation
Jan 25, 2023
01:22 PM
Hello all,
I think I am in the correct thread. I am having a similar problem. Essentially, I am trying to make a Bode plot on the last page of this MathCAD Prime 8 file.
Thank you in advance for any help with this issue.
Kind regards,
Kyle
Jan 25, 2023
03:01 PM
- Mark as New
- Bookmark
- Subscribe
- Mute
- Subscribe to RSS Feed
- Permalink
- Notify Moderator
Please log in to access translation
Jan 25, 2023
03:01 PM
@Werner_E
Hm...Werner, one of the problems here is related to what I posted already previous days about the inverse of a matrix and calculating the determinant:


Maybe Werner can better explain the problems related to calculating the inverse of a matrix, and calculating the determinant..problems you encounter at least in Mathcad (Prime)...
Another problem that I see:


Jan 25, 2023
04:12 PM
- Mark as New
- Bookmark
- Subscribe
- Mute
- Subscribe to RSS Feed
- Permalink
- Notify Moderator
Please log in to access translation
Jan 25, 2023
04:12 PM
@KAndersen wrote:
Hello all,
I think I am in the correct thread.
I tend to disagree! This nearly five year old thread is not YOUR thread and this thread already was so often hijacked by people having various problems with plotting for different reasons. So its rather long and dealing with various different, unrelated problems which strongly diminishes the willingness to deal with it in more detail. Furthermore this thread is already closed / marked as "answered". So follow up posting sure don't get the same attention as a new opened thread will get.
So I can only suggest that you open a new thread with your question. You don't need to zip the worksheet to attach it.
I would also suggest that you clearly describe what kind of plot you would like to see because the way you had setup your plot sure can't result in a bode plot. The error message states that Prime (on contrary to real Mathcad) does not allow two arguments being ranges. Furthermore you just have nine values for "n" and four values for "exp" - so at the best your plot would consist of just 36 separate points!
BTW, I don't think that your problem is in any way related to the one of @Cornel which had to do with symbolic evaluations in this still open thread https://community.ptc.com/t5/Mathcad/Determinat-of-a-Matrix-Mathcad-Prime-8-Strange-Result/m-p/851428/highlight/true#M204835
Jan 25, 2023
04:20 PM
- Mark as New
- Bookmark
- Subscribe
- Mute
- Subscribe to RSS Feed
- Permalink
- Notify Moderator
Please log in to access translation
Jan 25, 2023
04:20 PM
See attached file.
Success!
Luc
Jan 25, 2023
04:30 PM
- Mark as New
- Bookmark
- Subscribe
- Mute
- Subscribe to RSS Feed
- Permalink
- Notify Moderator
Please log in to access translation
Jan 25, 2023
04:30 PM
Using the quickplot feature (=not defining the frequency via "logspace" or "Decade", leaving "fr" undefined and setting the plot ranges in the plot itself by editing the first an last value at the x-axis) seems to provide a nicer output.

EDIT: Of course using your method you can get an equally smooth plot if you use more than just 10 points per decade. The benefit of using "logspace" or your "Decade" is sure having a better control over the output.
Jan 26, 2023
09:47 AM
- Mark as New
- Bookmark
- Subscribe
- Mute
- Subscribe to RSS Feed
- Permalink
- Notify Moderator
Please log in to access translation
Jan 26, 2023
09:47 AM
Thank you everyone!
@Werner_E @LucMeekes @Cornel
I am very grateful for the help. I used your suggestions and the plot coming along nicely.
I apologize for posting in a closed thread. It won't happen again.
Kind regards,
Kyle


