
Turn on suggestions
Auto-suggest helps you quickly narrow down your search results by suggesting possible matches as you type.
Showing results for
Turn on suggestions
Auto-suggest helps you quickly narrow down your search results by suggesting possible matches as you type.
Showing results for
Community Tip - Did you know you can set a signature that will be added to all your posts? Set it here! X
Options
- Subscribe to RSS Feed
- Mark Topic as New
- Mark Topic as Read
- Float this Topic for Current User
- Bookmark
- Subscribe
- Mute
- Printer Friendly Page
Velocity vector
Jan 29, 2013
06:37 AM
- Mark as New
- Bookmark
- Subscribe
- Mute
- Subscribe to RSS Feed
- Permalink
- Notify Moderator
Jan 29, 2013
06:37 AM
Velocity vector
Hello everyone,
I am working in a fluid mechanics thesis(in mathcad) and I confront a problem with the visualisation of velocity field. The function of velocity depends on vaiables r,z (I've already found a set of values of r,z). I would like to inform me if it is possible how to depict the velocity as a vector in the same graph with the r,z.
Thank you!
Labels:
- Labels:
-
Other
17 REPLIES 17
Jan 29, 2013
08:35 AM
- Mark as New
- Bookmark
- Subscribe
- Mute
- Subscribe to RSS Feed
- Permalink
- Notify Moderator
Jan 29, 2013
08:35 AM
Can you please show some picture or Mathcad-sheet - what do you like to get!
Jan 29, 2013
09:29 AM
- Mark as New
- Bookmark
- Subscribe
- Mute
- Subscribe to RSS Feed
- Permalink
- Notify Moderator
Jan 29, 2013
09:29 AM
Which version of Mathcad are you using?
Jan 29, 2013
09:38 AM
- Mark as New
- Bookmark
- Subscribe
- Mute
- Subscribe to RSS Feed
- Permalink
- Notify Moderator
Jan 29, 2013
09:38 AM
The attached might be of some help (as long as you are using M15)
Also, if you look at http://communities.ptc.com/message/195993#195993 Richard has provided a slicker way of drawing an arrow - though it's in Mathcad Prime format.
Alan
Jan 29, 2013
10:24 AM
- Mark as New
- Bookmark
- Subscribe
- Mute
- Subscribe to RSS Feed
- Permalink
- Notify Moderator
Jan 29, 2013
10:24 AM
Here's the original, for MC15 and earlier.
Jan 30, 2013
07:35 AM
- Mark as New
- Bookmark
- Subscribe
- Mute
- Subscribe to RSS Feed
- Permalink
- Notify Moderator
Jan 30, 2013
07:35 AM
Hello. I tried your method, but I met problem in depiction of the vectors. In which part of the code this parameter is regulated? Thank you!
Jan 30, 2013
11:27 AM
- Mark as New
- Bookmark
- Subscribe
- Mute
- Subscribe to RSS Feed
- Permalink
- Notify Moderator
Jan 30, 2013
11:27 AM
Leni Kat wrote:
Hello. I tried your method, but I met problem in depiction of the vectors. In which part of the code this parameter is regulated? Thank you!
You haven't explained what your problem is sufficiently for me to give a sensible answer. What exactly is the problem?
It would help if you were to upload your worksheet, as far as you've managed it, so we have the actual vector field to use rather than playing with arbitrary fields.
Alan
Jan 30, 2013
01:18 PM
- Mark as New
- Bookmark
- Subscribe
- Mute
- Subscribe to RSS Feed
- Permalink
- Notify Moderator
Jan 30, 2013
01:18 PM
I attach the mathcad sheet. I met a problem in defining the length of the vector.
Jan 31, 2013
05:11 AM
- Mark as New
- Bookmark
- Subscribe
- Mute
- Subscribe to RSS Feed
- Permalink
- Notify Moderator
Jan 31, 2013
05:11 AM
Still a bit of a scaling problem, but does the attached contain the sort of thing you expect to see?
Alan
Jan 31, 2013
04:46 PM
- Mark as New
- Bookmark
- Subscribe
- Mute
- Subscribe to RSS Feed
- Permalink
- Notify Moderator
Jan 31, 2013
04:46 PM
I just saw your response. Thank you very much for your interest. Your suggestion was very helpful.
Jan 31, 2013
06:07 PM
- Mark as New
- Bookmark
- Subscribe
- Mute
- Subscribe to RSS Feed
- Permalink
- Notify Moderator
Jan 31, 2013
06:07 PM
You could also try a combination of logarithmic and linear scaling of the velocities to avoid throwing away some points - see attached. How useful the resulting plot is though I wouldn't like to say!!
Alan
Feb 03, 2013
04:38 PM
- Mark as New
- Bookmark
- Subscribe
- Mute
- Subscribe to RSS Feed
- Permalink
- Notify Moderator
Feb 03, 2013
04:38 PM
I appreciate so much your help. The sheet that you send me worked well! Now, I have the radial and axial components of velocity and I have to plot the total component velocity which is tangenial on the stream line. So I have to find the gradient of vector using the arc tagent of Vr/Vz. I don't know how to put this angle at the total component of velocity.
Thank you very much!
Feb 04, 2013
05:35 AM
- Mark as New
- Bookmark
- Subscribe
- Mute
- Subscribe to RSS Feed
- Permalink
- Notify Moderator
Feb 04, 2013
05:35 AM
Leni Kat wrote:
I appreciate so much your help. The sheet that you send me worked well! Now, I have the radial and axial components of velocity and I have to plot the total component velocity which is tangenial on the stream line. So I have to find the gradient of vector using the arc tagent of Vr/Vz. I don't know how to put this angle at the total component of velocity.
Thank you very much!
I'm not sure I understand you. Yourt latest worksheet contains values of v that are all real, so they point in the z direction only. You have labelled these as 'total' velocities. I would expect the 'total' velocities to have a combination of real and imaginary components. However, if they are the 'total' velocities then they are plotted correctly.
If they are just the magnitudes of the total velocities then you need to find the r and z components seperately in order to find the angles.
Do you mean something like the attached?
Alan
Jan 29, 2013
02:37 PM
- Mark as New
- Bookmark
- Subscribe
- Mute
- Subscribe to RSS Feed
- Permalink
- Notify Moderator
Jan 29, 2013
02:37 PM
Thank you all. I use the version of mathcad14. I will try your methods and see the results.
Jan 29, 2013
03:45 PM
- Mark as New
- Bookmark
- Subscribe
- Mute
- Subscribe to RSS Feed
- Permalink
- Notify Moderator
Jan 29, 2013
03:45 PM
Here's another great worksheet from Stuart that you might find useful.
Jan 29, 2013
03:30 PM
- Mark as New
- Bookmark
- Subscribe
- Mute
- Subscribe to RSS Feed
- Permalink
- Notify Moderator
Jan 29, 2013
03:30 PM
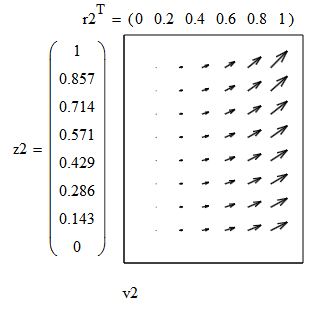
For the lazy person, you can use the 3D vector field plot and just show the r and z vectors along the axes. This gives an approximation because the r and z values are not precisely aligned with the plot, but the trends are shown.
I reversed the r, z and v rows and columns to make r2, z2 and v2. Then, after making the plot and aligning the r2 and z2 vectors alongside the plot, I captured the group in a picture. This allowed me to expand the picture so everything remained in the original proportion.
For development work, this may be okay, but not for publication.
Jan 30, 2013
07:31 AM
- Mark as New
- Bookmark
- Subscribe
- Mute
- Subscribe to RSS Feed
- Permalink
- Notify Moderator
Jan 30, 2013
07:31 AM
Thanks for your response..I searched about 3d vector field plot but I think that my version doesn't support it.
I'll check once more your method.
Jan 30, 2013
12:10 PM
- Mark as New
- Bookmark
- Subscribe
- Mute
- Subscribe to RSS Feed
- Permalink
- Notify Moderator
Jan 30, 2013
12:10 PM
Leni Kat schrieb:
Thanks for your response..I searched about 3d vector field plot but I think that my version doesn't support it.
I'll check once more your method.
You wrote that you are using Mathcad 14, so your version supports vector field plots.
You may insert that graph via "Insert/Graph/Vector Field Plot".
If you have already inserted a "normal" 3D-graph (for instance a surface plot via ctrl-2), you can change the plot type in the 3-D plot Format menu (double clicking the graph) in tab "General".

