
Turn on suggestions
Auto-suggest helps you quickly narrow down your search results by suggesting possible matches as you type.
Showing results for
Turn on suggestions
Auto-suggest helps you quickly narrow down your search results by suggesting possible matches as you type.
Showing results for
Options
- Subscribe to RSS Feed
- Mark Topic as New
- Mark Topic as Read
- Float this Topic for Current User
- Bookmark
- Subscribe
- Mute
- Printer Friendly Page
Zero up crossing frequency in a random signal
Mar 31, 2017
04:56 AM
- Mark as New
- Bookmark
- Subscribe
- Mute
- Subscribe to RSS Feed
- Permalink
- Notify Moderator
Mar 31, 2017
04:56 AM
Zero up crossing frequency in a random signal
Hi everyone,
I already asked a related question in this old thread.
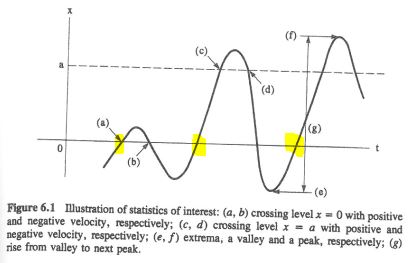
For a random (vibration) signal there are two important statistical values: the peak rate and the zero up crossing frequency. The first one I was able to compute using a the function localmax provided in the "Data Analysis Extension Pack". Now I would also need the zero up crossing frequency, that is the number of time the signal crosses the X-axis going up. To clarify here is an image from Wirsching, Random Vibration. The zero up crossing in the example are highlighted in yellow.
Before I start writing a simple iterative program like 
for i=0 to npoints
if x(i) <0 and x(i+1) >0 then
zup=zup+1
endif
next i
... I just wanted to ask if someone in the community knows some elegant and straightforward way, similar to the "localmax" function. That function has the advantage of providing the ability to give a window width (for noisy signals).
Thanks a lot
Regards
Claudio
PS: the other thread about localmax/localmin contains sample data and sample Mathcad worksheet to read them
4 REPLIES 4
Mar 31, 2017
05:12 AM
- Mark as New
- Bookmark
- Subscribe
- Mute
- Subscribe to RSS Feed
- Permalink
- Notify Moderator
Mar 31, 2017
05:12 AM
No, I don't have the answer straight away. But I do share your observation on noise:
Suppose your signal is noisy (most real wold signals are). Then when the signal of interest is around zero level you may get a lot of up-crossings, possibly in short time.
Apart from a window in time another approach could be that a crossing is only counted if the previous crossing was followed by reaching a certain (positive) level.
Success!
Luc
Mar 31, 2017
05:32 AM
- Mark as New
- Bookmark
- Subscribe
- Mute
- Subscribe to RSS Feed
- Permalink
- Notify Moderator
Mar 31, 2017
05:32 AM
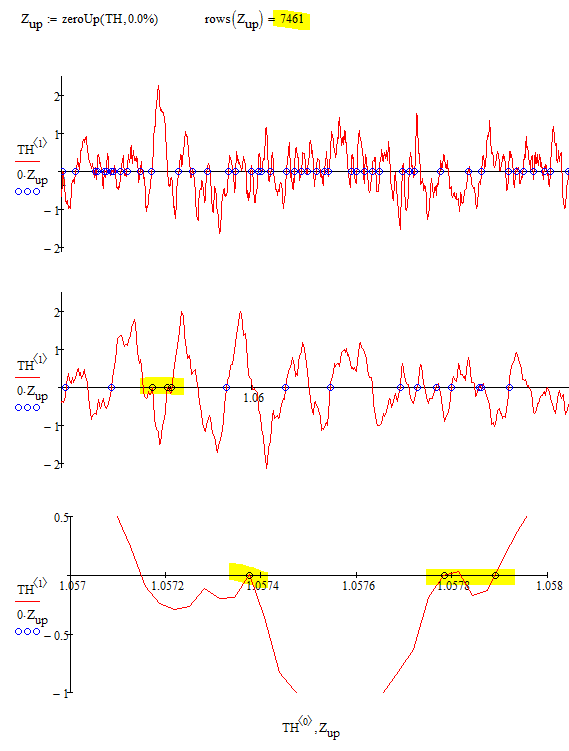
Here to clarify (thanks Luc) a few zooms on a signal on which I am testing my algorithm: at the highest zoom it is clear that there are "false positives".
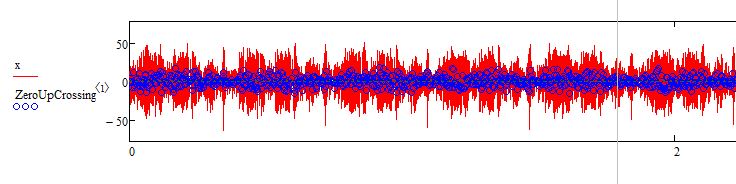
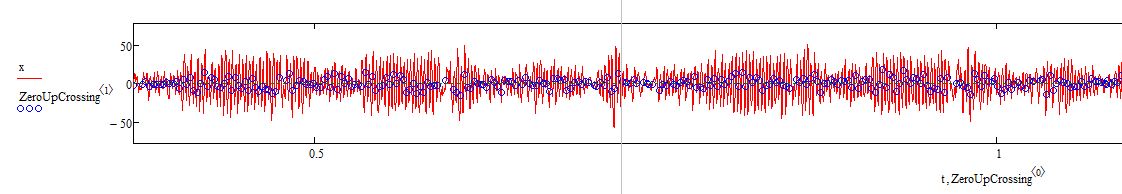
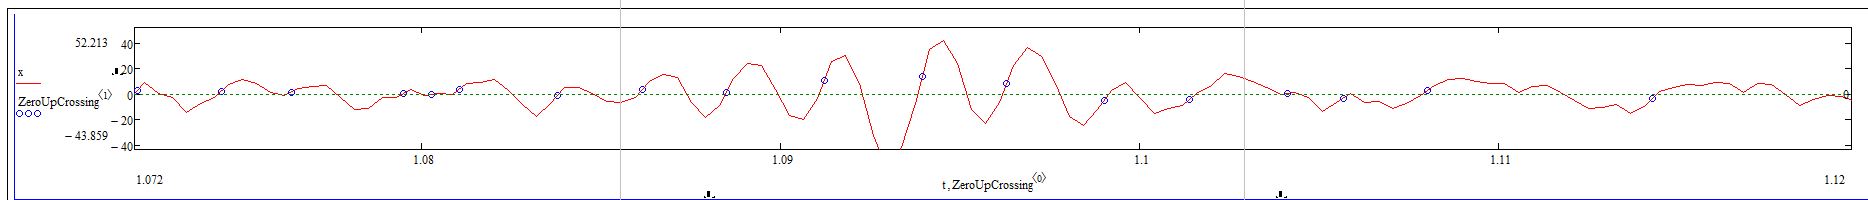
The blue points are just midway between the two data points. I do not need an exact estimate of the time of zero crossing. The important value is the rate, that is the total amount/duration.
Mar 31, 2017
12:54 PM
- Mark as New
- Bookmark
- Subscribe
- Mute
- Subscribe to RSS Feed
- Permalink
- Notify Moderator
Mar 31, 2017
12:54 PM
Its not much more work to "exactly" calculate the point of zero
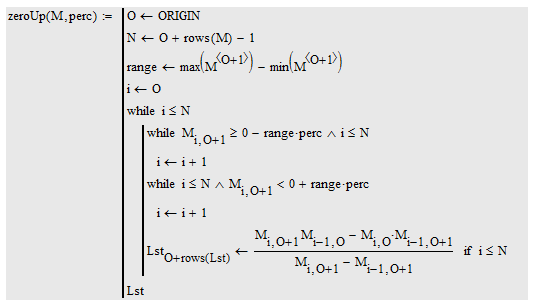
The argument "perc" is a first try to deal with a noisy signal and it defines a range around zero in relation to the full range of the signal which is seen as zero. crossings in that range are not taken in acount.
I am not sure how to deal with a time window in that case - averaging the values in the window would mean smoothing the signal and so we could as easily use one of the available smoothing functions.
See the difference here:

EDIT: Changed a small detail in "zeroUp" in the attached file.
Apr 03, 2017
02:22 AM
- Mark as New
- Bookmark
- Subscribe
- Mute
- Subscribe to RSS Feed
- Permalink
- Notify Moderator
Apr 03, 2017
02:22 AM
Hey, thanks a lot Werner!
That's very kind of you. I will integrate your algorithm in my worksheet, with reference to the source.
The signal I have is of course also noisy, but I was a little lazy and I did not do my homework ;-).
I do not believe one should average on the time. The main point of computing the "peak rate" and the "zero up crossing rate" (at least for random vibration) is to compute then the ratio of them, (named irregularity factor, alfa=zero crossing rate/peak rate, 1 for strictly narrow band process (think a sinus wave) and going to zero as the bandwidth increases). So I believe the only "noise" parameter should be in the Y direction, exactly ad you did.
Best regards & thanks again
Claudio

