
Turn on suggestions
Auto-suggest helps you quickly narrow down your search results by suggesting possible matches as you type.
Showing results for
Turn on suggestions
Auto-suggest helps you quickly narrow down your search results by suggesting possible matches as you type.
Showing results for
Community Tip - Learn all about PTC Community Badges. Engage with PTC and see how many you can earn! X
Options
- Subscribe to RSS Feed
- Mark Topic as New
- Mark Topic as Read
- Float this Topic for Current User
- Bookmark
- Subscribe
- Mute
- Printer Friendly Page
peaks for various graphs?
Dec 04, 2010
04:25 PM
- Mark as New
- Bookmark
- Subscribe
- Mute
- Subscribe to RSS Feed
- Permalink
- Notify Moderator
Dec 04, 2010
04:25 PM
peaks for various graphs?
Hi,
im having trouble with finding the peaks of a various data sets.
im attaching 3 data sets.. is there any way that the peaks can be found for them?
im thinking of smoothing the data first using supsmooth and then it will be easier. so im attaching the matcad 11 file and im also adding some explanation within it.
update:
searched google and came accross this. its one of the sample files
http://support.mathsoft.com/support/mcad8/Examples/Locate_peaks.mcd
but its not there anymore.. does anyone know where can I get it? or is it even what im looking for
Message was edited by: UKMan
Solved! Go to Solution.
Labels:
- Labels:
-
Statistics_Analysis
1 ACCEPTED SOLUTION
Accepted Solutions
Dec 05, 2010
09:34 AM
- Mark as New
- Bookmark
- Subscribe
- Mute
- Subscribe to RSS Feed
- Permalink
- Notify Moderator
Dec 05, 2010
09:34 AM
Here's another approach. I've posted these functions before I think, but I don't recall which thread (and can't be bothered to search for it!). These are newer versions though, so if anyone has the old ones they should replace them.
As a note, if you choose the window as 10 and the threshold as 5% it will find the two peaks in the unsmoothed data, in all three cases. For data set 1 it finds only the higher peak in the doublet. If you actually wanted to find both peaks in the doublet you could change the window size to 4.
9 REPLIES 9
Dec 04, 2010
08:33 PM
- Mark as New
- Bookmark
- Subscribe
- Mute
- Subscribe to RSS Feed
- Permalink
- Notify Moderator
Dec 04, 2010
08:33 PM
very primitive method that relies upon having reasonably smooth data. haven't got time to find a 'proper' method, so this is just a top of the head thing.
Stuart
Dec 05, 2010
04:48 AM
- Mark as New
- Bookmark
- Subscribe
- Mute
- Subscribe to RSS Feed
- Permalink
- Notify Moderator
Dec 05, 2010
04:48 AM
Of course, if I had any brains then apart from using a proper technique, I would have embedded the smoothing function within the peak detector. 
Stuart
Dec 05, 2010
12:34 PM
- Mark as New
- Bookmark
- Subscribe
- Mute
- Subscribe to RSS Feed
- Permalink
- Notify Moderator
Dec 05, 2010
12:34 PM
Lovely work, great explanatory worksheet.
Mike
Dec 05, 2010
04:46 PM
- Mark as New
- Bookmark
- Subscribe
- Mute
- Subscribe to RSS Feed
- Permalink
- Notify Moderator
Dec 05, 2010
04:46 PM
thanks a lot stuart_bruff 
the explanation you did on that worksheet is epic
Dec 05, 2010
09:34 AM
- Mark as New
- Bookmark
- Subscribe
- Mute
- Subscribe to RSS Feed
- Permalink
- Notify Moderator
Dec 05, 2010
09:34 AM
Here's another approach. I've posted these functions before I think, but I don't recall which thread (and can't be bothered to search for it!). These are newer versions though, so if anyone has the old ones they should replace them.
As a note, if you choose the window as 10 and the threshold as 5% it will find the two peaks in the unsmoothed data, in all three cases. For data set 1 it finds only the higher peak in the doublet. If you actually wanted to find both peaks in the doublet you could change the window size to 4.
Dec 05, 2010
12:39 PM
- Mark as New
- Bookmark
- Subscribe
- Mute
- Subscribe to RSS Feed
- Permalink
- Notify Moderator
Dec 05, 2010
12:39 PM
Very nice Richard.
There would be a neat method if the number of peaks is known. The data could be sorted and the corresponding peak values could then be extracted.
Simple but effective
Mike
Dec 05, 2010
04:47 PM
- Mark as New
- Bookmark
- Subscribe
- Mute
- Subscribe to RSS Feed
- Permalink
- Notify Moderator
Dec 05, 2010
04:47 PM
thanks a lot
going through it now..
and yes i agree with you.. why re-invent the wheel
Dec 05, 2010
06:30 PM
- Mark as New
- Bookmark
- Subscribe
- Mute
- Subscribe to RSS Feed
- Permalink
- Notify Moderator
Dec 05, 2010
06:30 PM
Oops! Sorry about that folks. I had to modify the function to get it to handle the current data correctly (the old version did not like lots of zero values) and I didn't test it sufficiently on other data before posting it. There was a serious bug. Here's a new version that works for all the data I used to test it (which includes data other than that posted in this thread).
Stuart, and others praise for his excellent documentation, also embarrassed me into providing a little more explanation for how this function works

Dec 06, 2010
02:03 AM
- Mark as New
- Bookmark
- Subscribe
- Mute
- Subscribe to RSS Feed
- Permalink
- Notify Moderator
Dec 06, 2010
02:03 AM
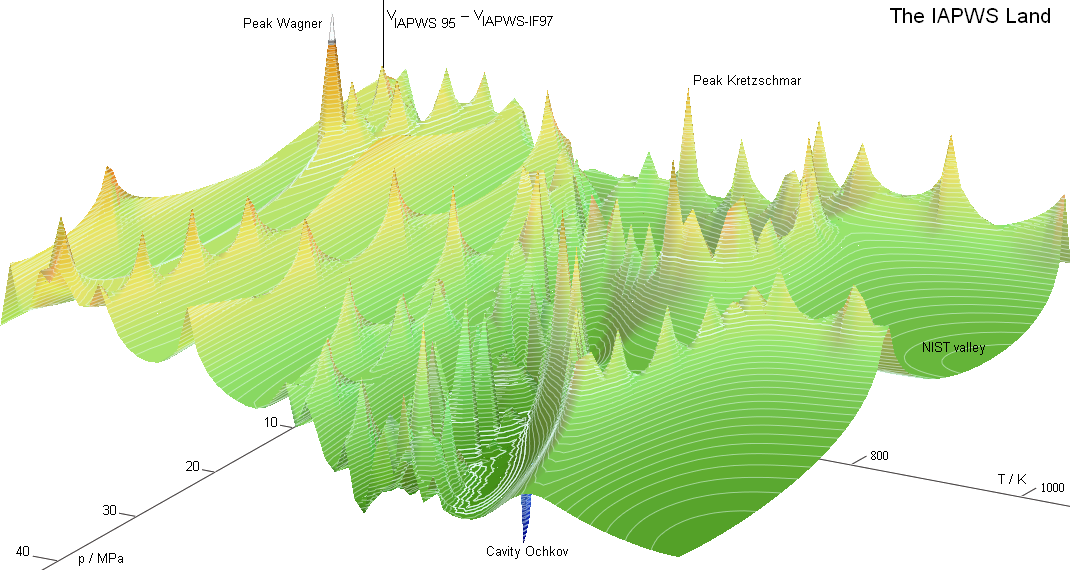
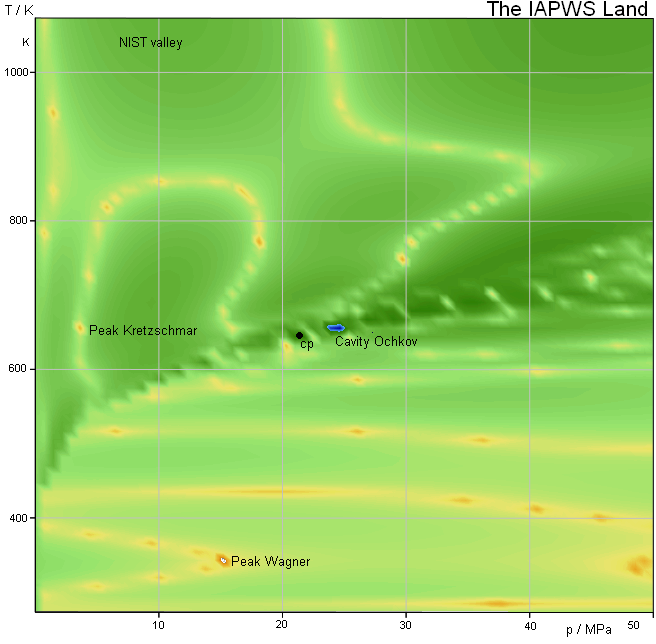
A have calculated by Mathcad help a spesific vavue of water and steam by 2 formulations - IAPWS-95 and IAPWS-IF97
The different between this calculations you can see as a set os peaks: see surface and counter plot

