Solved
How can i find the best distribution: weibull or exponential distribution for this data?
Hi everyone
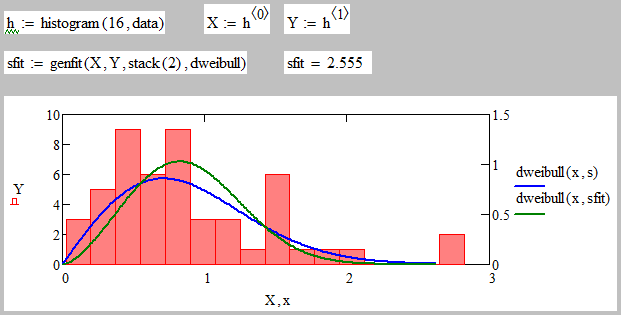
can anyone help me to find the best distribution: weibull or exponential distribution for this data using Mathcad, please?
1.393 0.66 1.032 0.336 1.451 0.489 1.123 1.789 1.542 0.051 1.654 2.813 0.736 0.637 1.477 0.859 2.017 0.391 0.754 0.26 0.127 0.725 0.842 0.28 0.396 0.022 0.623 1.205 0.312 0.986 0.534 2.818 1.184 0.656 0.315 0.806 0.444 0.848 0.443 0.64 0.456 0.678 1.527 0.901 0.758 0.434 1.468 0.795 0.503 1.541
i want the parameters for both of them please
thank for all