MENU
Start a topic
Search
LogIn
cancel
Turn on suggestions
Auto-suggest helps you quickly narrow down your search results by suggesting possible matches as you type.
Showing results for
Search instead for
Did you mean:
English
한국어
简体中文
日本語
Please log in to access translation
All community
This category
Knowledge
Users
cancel
Turn on suggestions
Auto-suggest helps you quickly narrow down your search results by suggesting possible matches as you type.
Showing results for
Search instead for
Did you mean:
Close X
ThingWorx Navigate is now Windchill Navigate
Learn More
Community
IoT & Connectivity
IoT & Connectivity Tips
How to display Connection server metrics with grap...
Please log in to access translation
한국어
简体中文
日本語
English
Original
Options
Subscribe to RSS Feed
Mark as New
Mark as Read
Bookmark
Subscribe
Printer Friendly Page
Notify Moderator
How to display Connection server metrics with graphic charts in ThingWorx
No ratings
Please log in to access translation
한국어
简体中文
日本語
English
Original
Connection server + InfluxDB + Grafana work together can display connection server metrics in graphic charts
Download and set up connection server
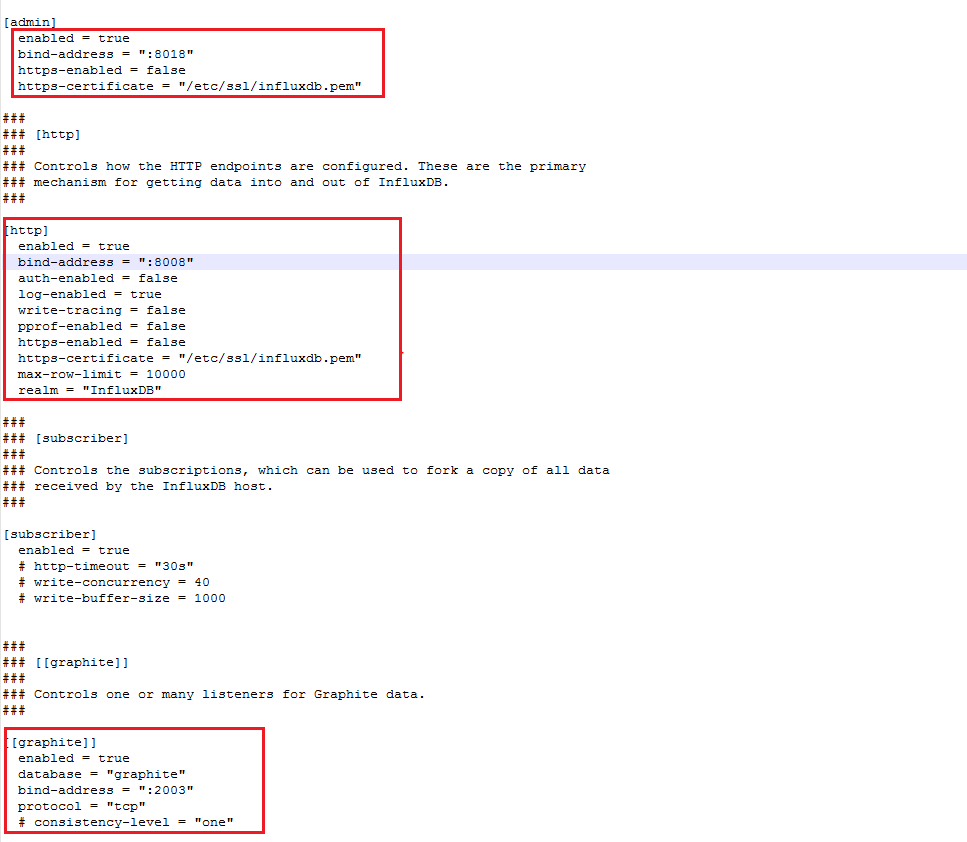
Download InfluxDB and configure InfluxDB
edit
<influxdb home>\influxdb.conf
file
Note: [admin] is InfluxDB admin login page, [http] is Grafana connected settings, [graphite] is connection server connected settings
Run
influxd.exe
file with below commands (windows cmd)
<path>
/influxd -config
<path>
/influxdb.conf
Run
influx.exe
file with below commands (in my case the port is 8008)
<path>
/influx -port 8008
Start connection server
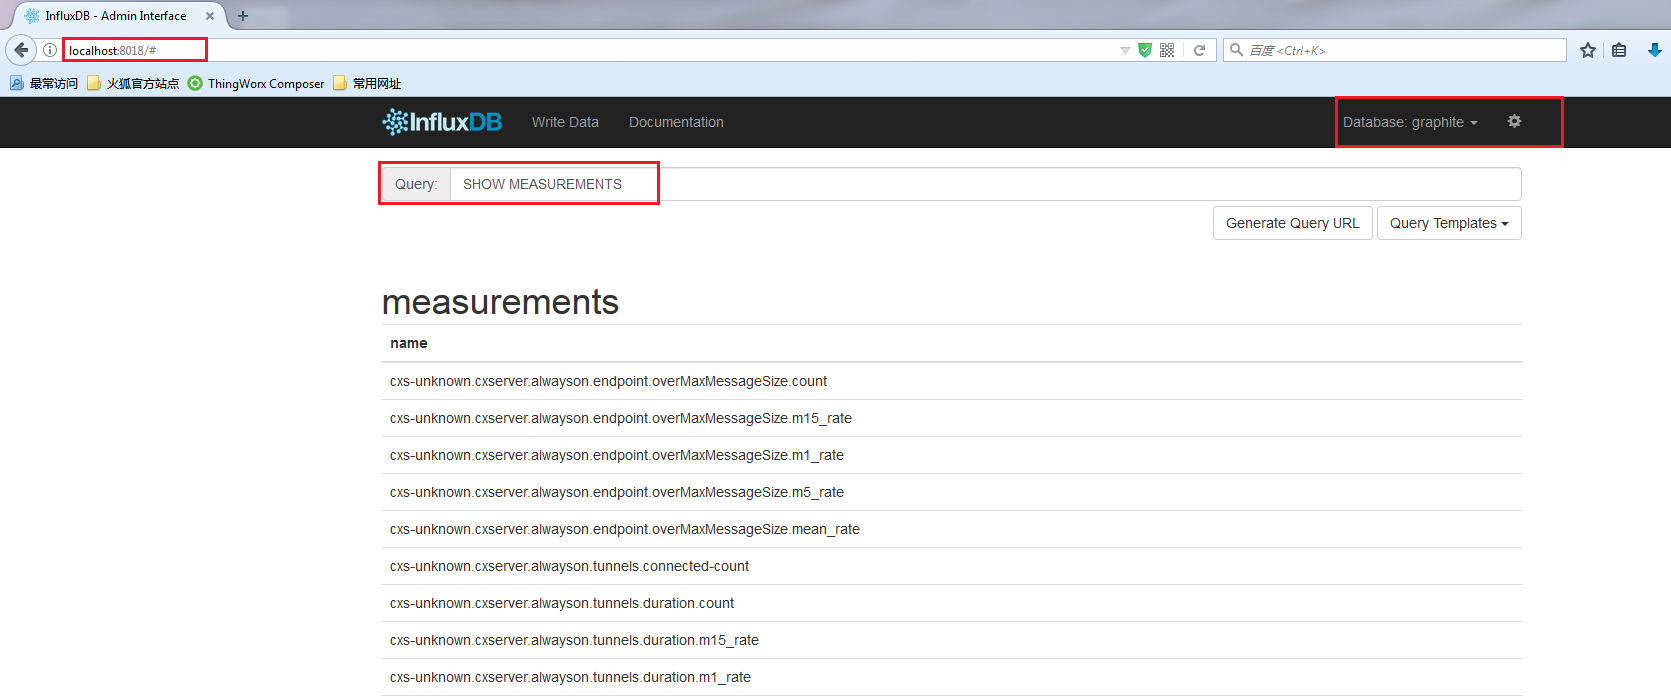
Login to InfluxDB by using URL
http://localhost:8018
. Choose Database
graphite
and Query
SHOW MEASUREMENTS
Note: There should be many connection server metrics
Double click
grafana-server.exe
file (<path>
/grafana-4.2.0.windows-x64/grafana-4.2.0/bin
)
Login to Grafana with URL
http://localhost:3000
The default login username and password is admin/admin
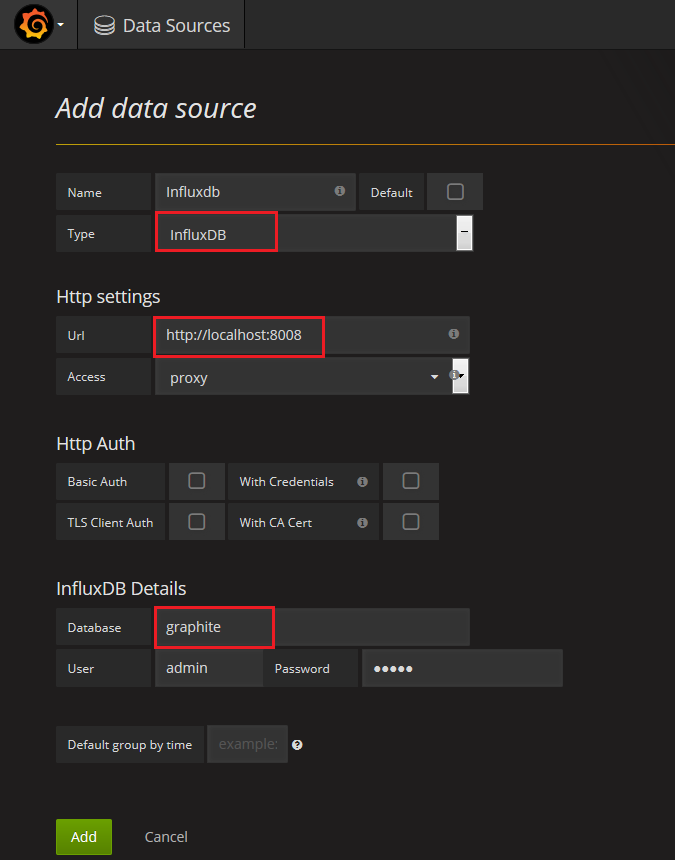
Create a new Data Source
Note:
Type
,
Url
and
Database
properties are required.
Save & Test. If the connection is set up successfully, there should be a green message pop-up.
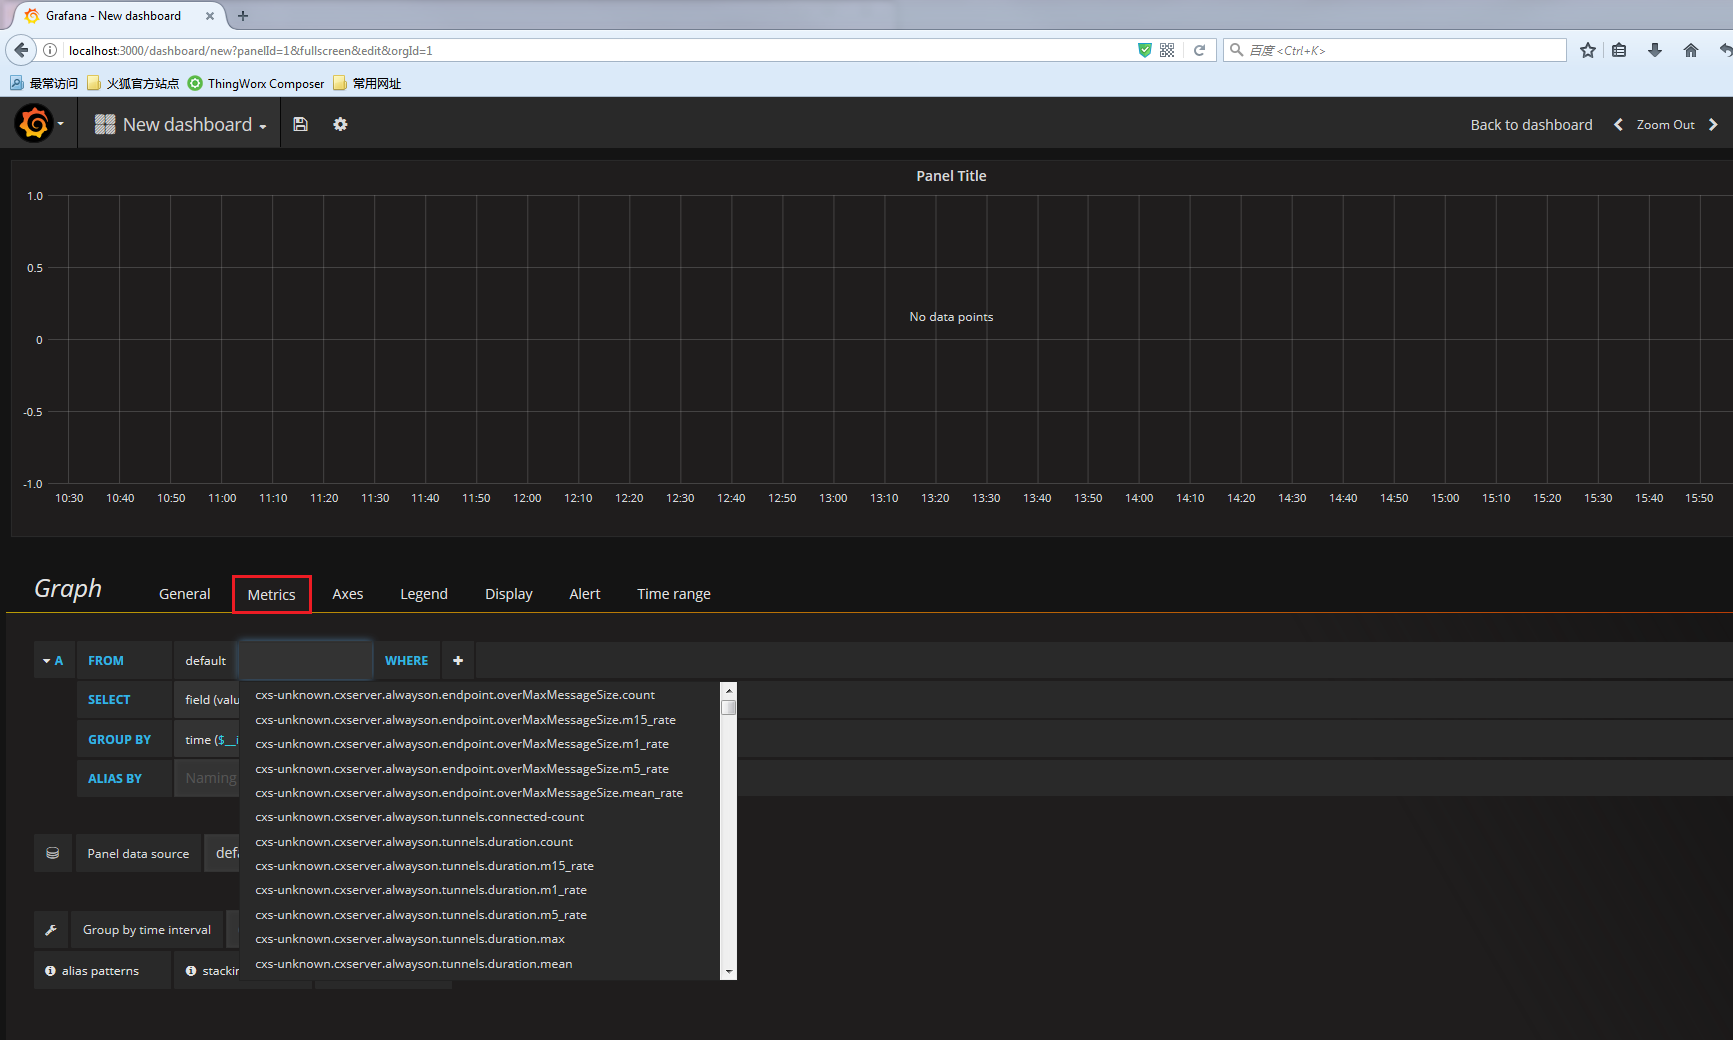
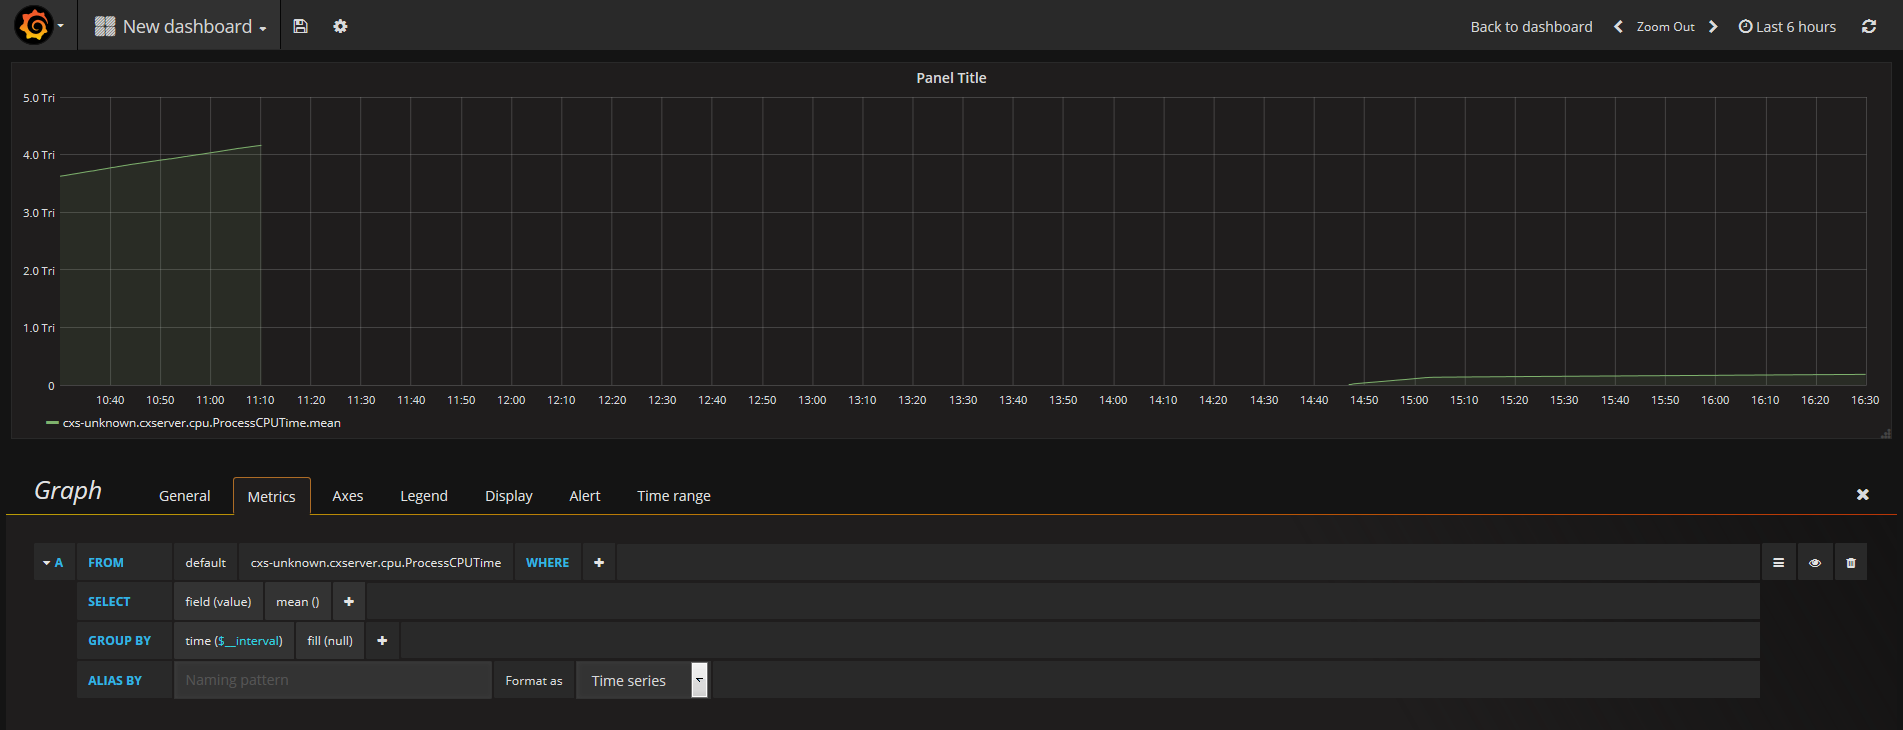
Create a new dashboard
Add a new Row, and set up its metrics by create new querys
Sample result:
Version history
Last update:
May 24, 2017
04:46 AM
Updated by:
liliu
Labels
(1)
Labels:
Connectivity
Tags
(2)
connectivity
edge sdk