- Community
- IoT & Connectivity
- IoT & Connectivity Tips
- Building More Complex Tests in JMeter
- Subscribe to RSS Feed
- Mark as New
- Mark as Read
- Bookmark
- Subscribe
- Printer Friendly Page
- Notify Moderator
Building More Complex Tests in JMeter
Building More Complex Tests in JMeter
Overview
This is the second in a series of articles which help inform how to do user load testing in ThingWorx. This article picks up where the previous left off, continuing with the project created there. The screenshots do appear a little differently here because a new “Look and Feel” was selected for the JMeter application (switched from “Metal” to “Windows Classic”) to provide more readable screenshots. In this guide, we are going to make the very simple project more complex, working towards a better representation of a real load test. The steps below walk you through how to create and configure thread groups and parameterize the processes and procedures defined by each thread group.
Adding More Thread Groups
Within JMeter, thread groups are used to organize the HTTP requests in a test into various processes or procedures, such that different mashups (and all of the HTTP requests required on each) or processes can be executed simultaneously by different thread groups throughout the test. Varying the number of threads in a group is how to vary the number of users accessing that mashup during the test, a number which increases over time in accordance with the ramp up time. The thread group name will also show up in the Summary Report tab at the end of the test, making it easier to parse through and graph the results.
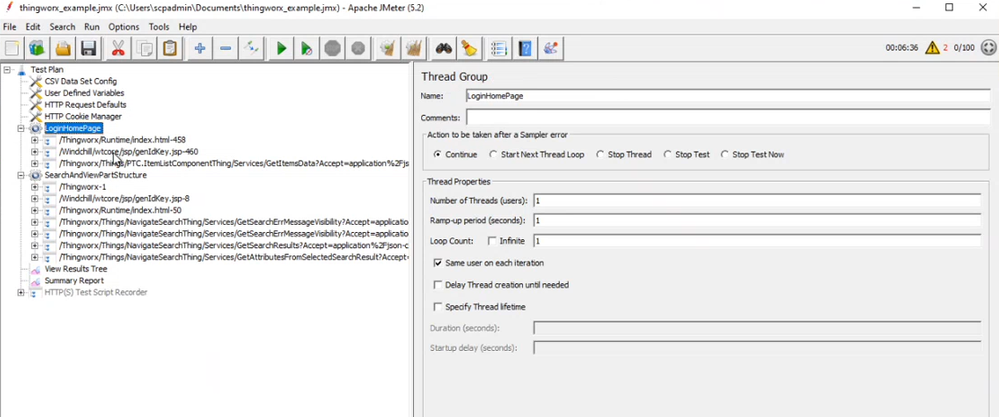
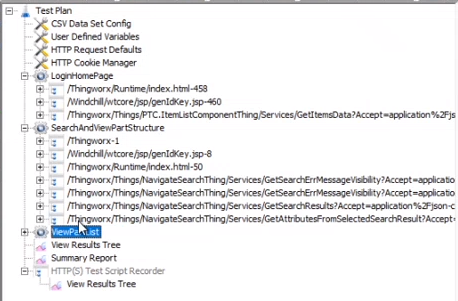
- Start by renaming the existing thread groups so that their process or procedure names are recognizable at the end of the test:
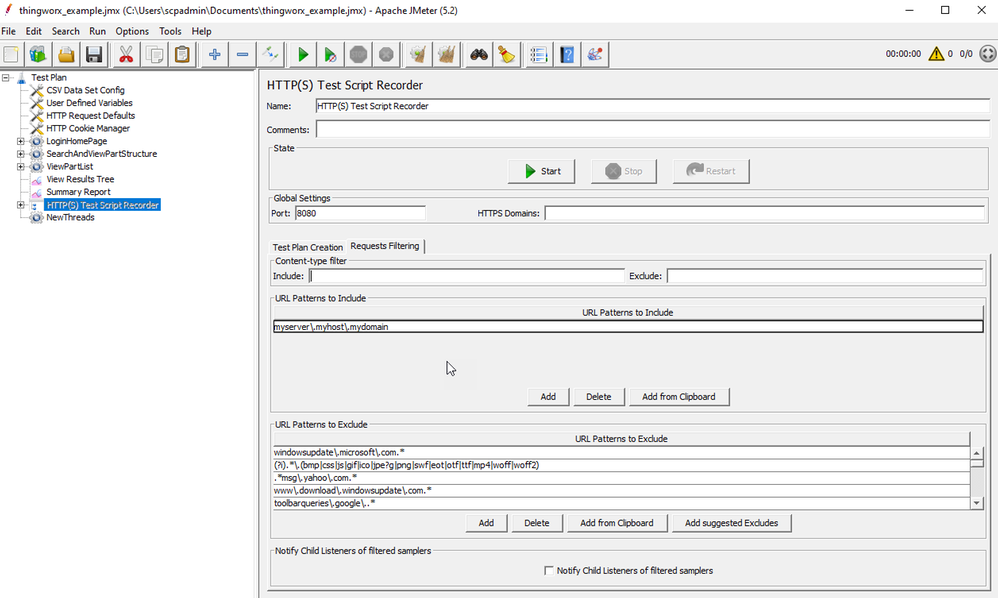
- Highlight the line which reads “HTTP(S) Test Script Recorder”. (Optional) Add an Include filter to only capture the URLs relevant to your application using the Requests Filtering tab. For example, with the escape character \ necessary for ‘.’, myhost.mycompany.mydomain becomes: myhost\.mycompany\.mydomain
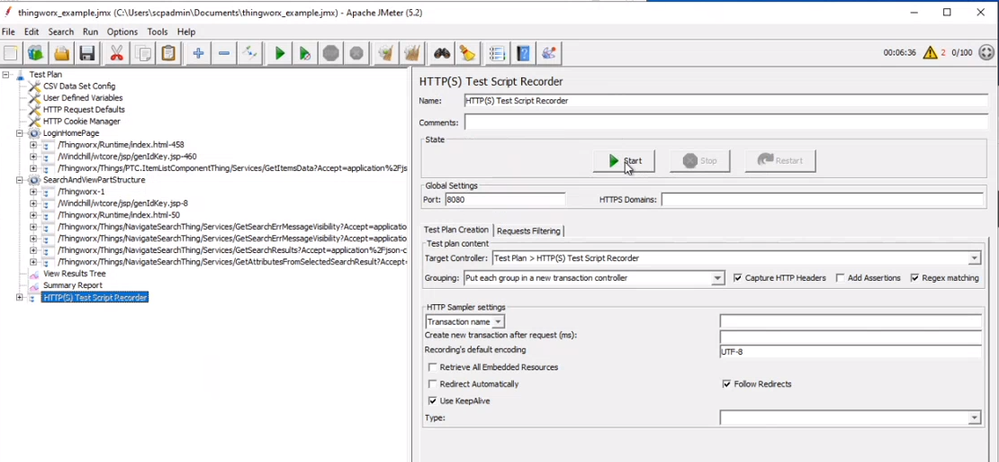
- Now record a new thread group clicking the “Start” button:
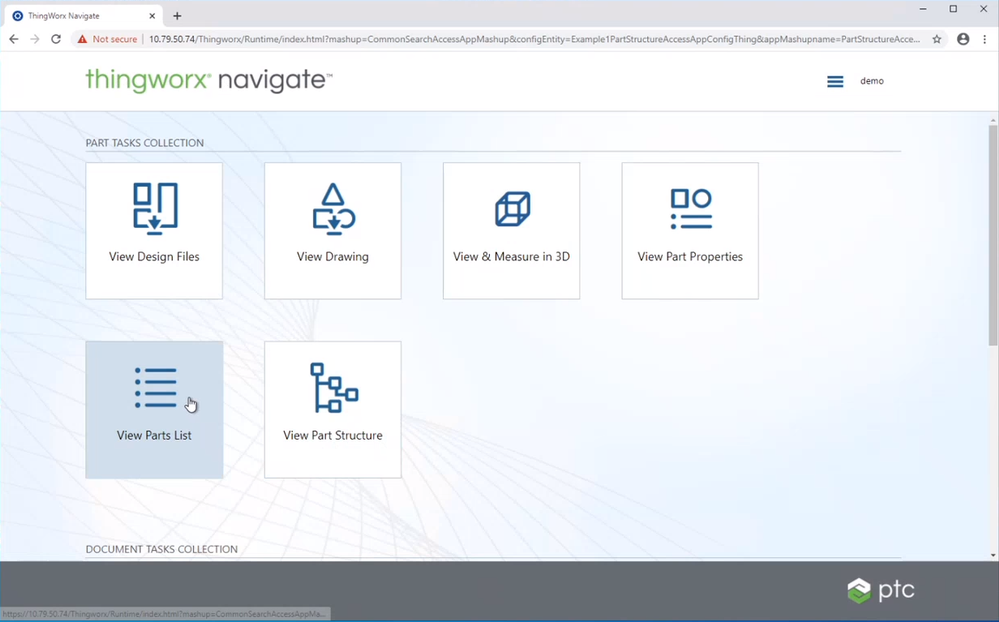
- Once the control box shows up in the top left corner, click to open a browser and access the ThingWorx Navigate application. Then click on “View Parts List” or some other mashup:
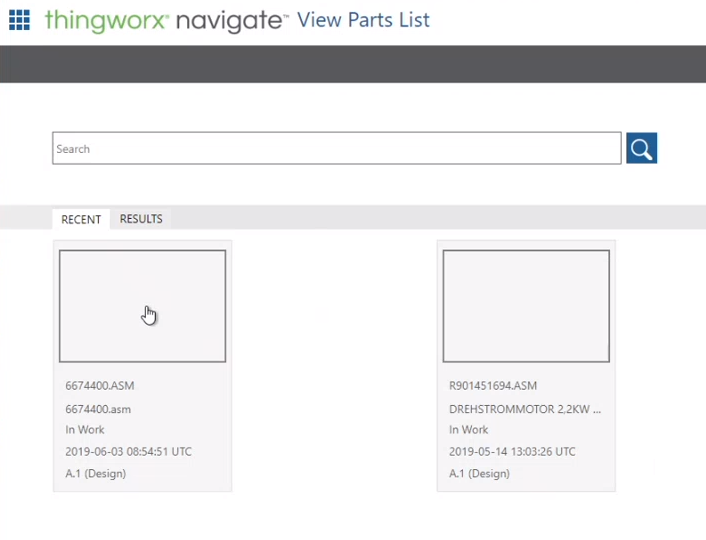
- Once the mashup loads, search using a string and/or wildcard, or click on one of the recent results if any exist:
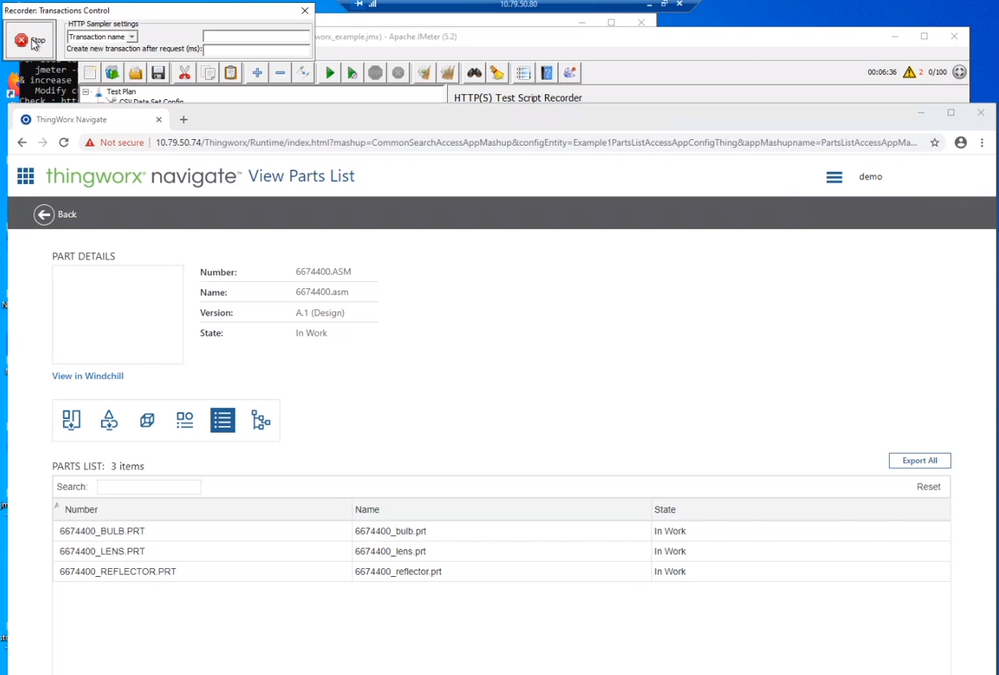
- Wait for the mashup to fully load with the details on that part or assembly, and then click “Stop” in the recording controller window:
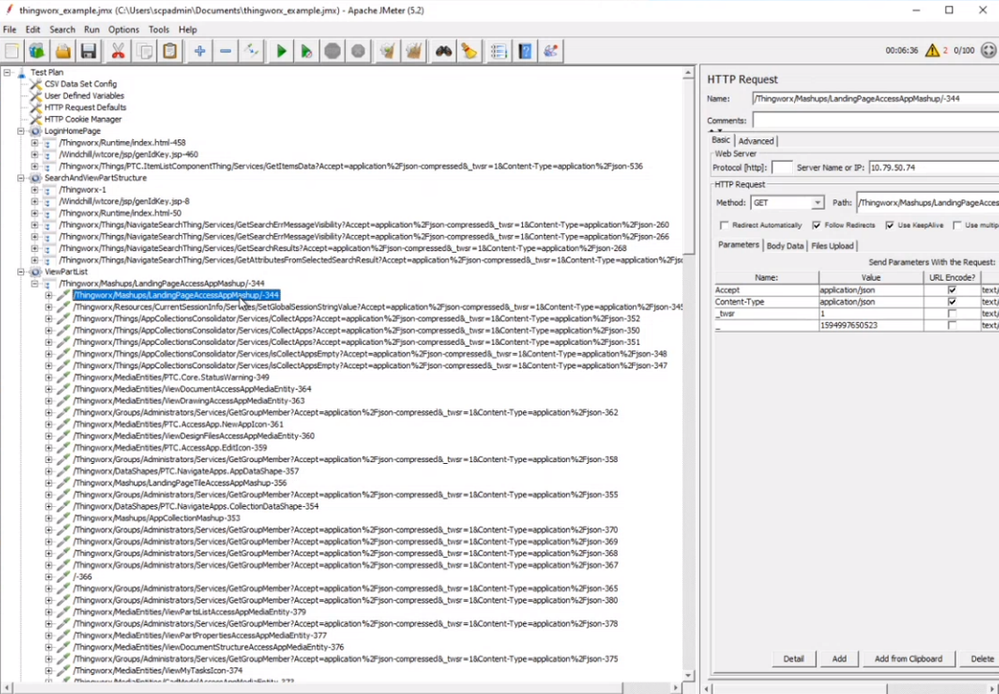
- All of the HTTP requests performed in the process of loading and using this mashup will be added to the JMeter project here:
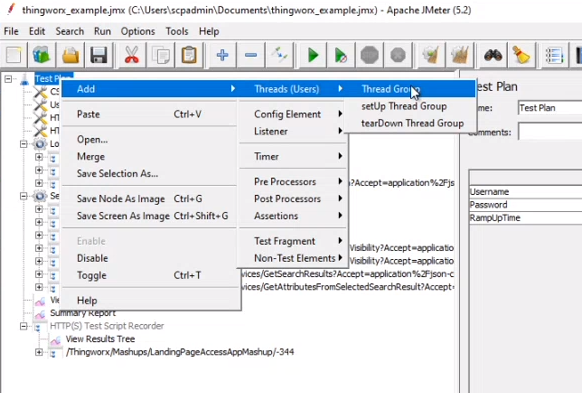
- Next, add a new thread group manually to the project:
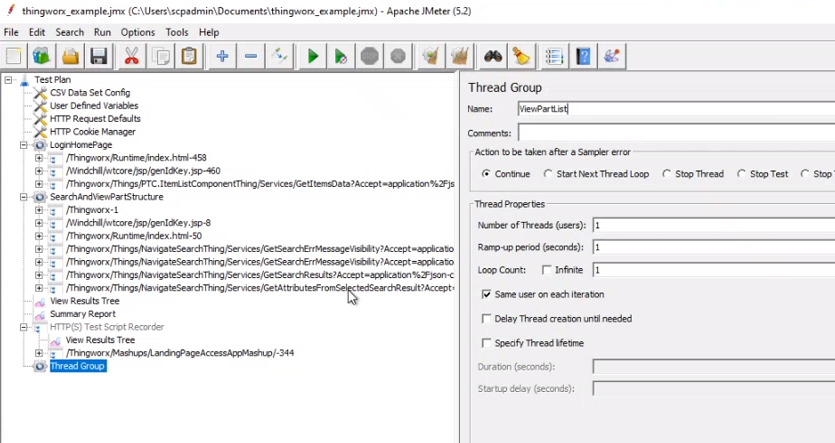
- Highlight the newly created “Thread Group” (default name) and rename it to something that relates to the nature of that process:
- Drag and drop the new collection of requests so that it is considered a part of the new thread group:
- Then drag the whole group up so that it is next to the other thread groups in the test:
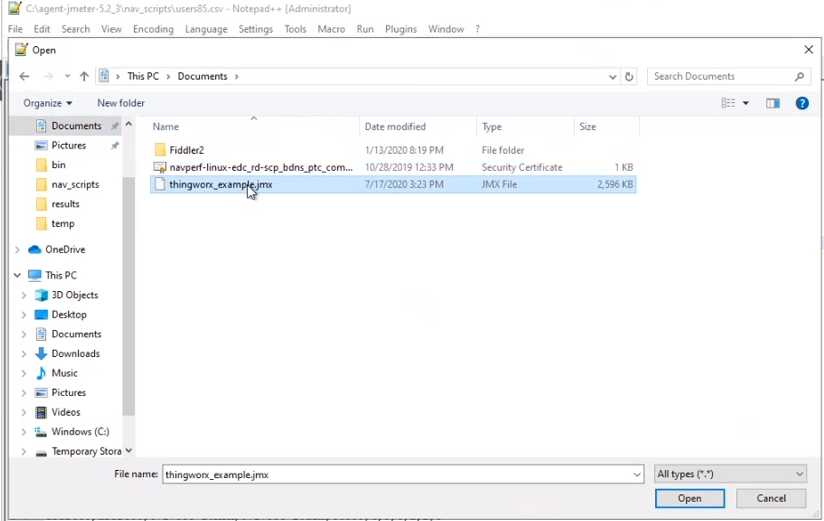
- In more complex projects, different thread groups may be added at different times, and each time, the service calls are all assigned an index (at the end of the request URL, for example: <request>-344). These indexes may not be unique depending on how and when the thread groups were created, especially in more complex tests. The easiest way to fix this issue is save the test from the JMeter GUI, then open the JMX file in a text editor and perform a find and replace within the relevant section of text.
This is usually done using a regular expression for the number. For example, if the request name indexes are numbered -500 through -525, a regular expression to increase them to -700 through -725 would be (in Notepad++):
Find: -5([0-9])([0-9])Replace: -7\1\2
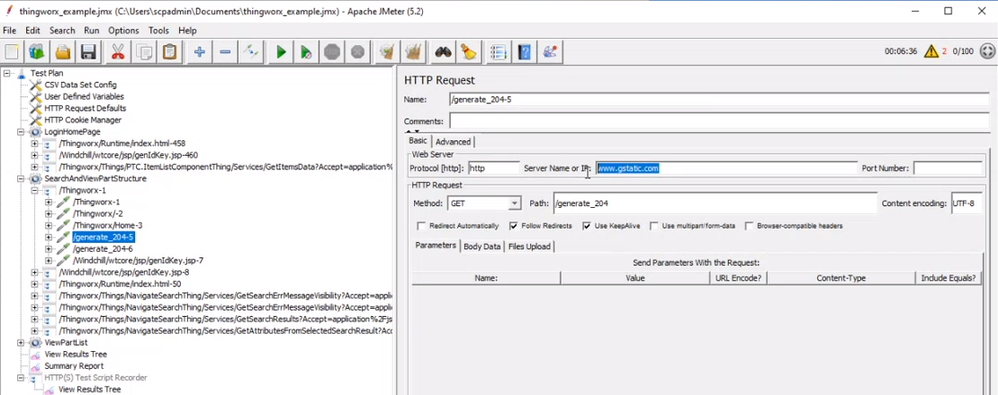
- Note that if you do not use a Request Filter, sometimes the recorder will log URLs that are not part of the target application, like these “generate” samplers. These URLs are typically happening in the background of the browser to track performance, security and errors. These can be deleted:
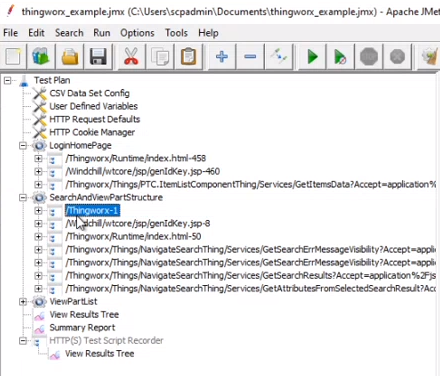
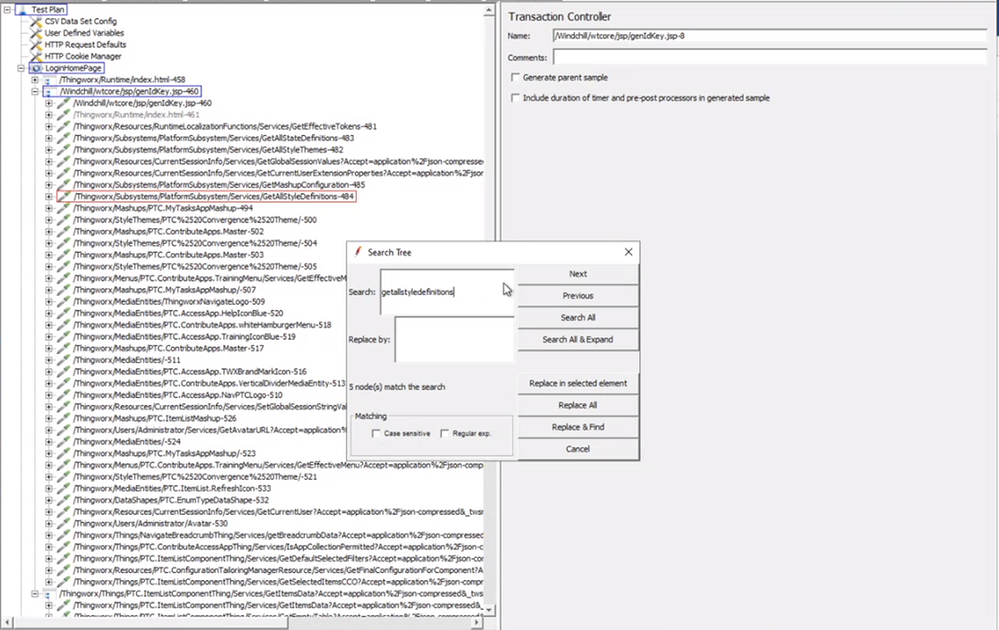
- At other times, you will be repeating steps that are already part of another thread group, for example: logging in. This genidkey is a part of the login, as you can see if you look back at the login thread group. Because logging in is only necessary once, and it is assumed to be complete by the time the test starts on the second thread group, this entire section can be deleted:
- To see for sure if a request can be removed because it is called in a previous thread group, do a non-case-sensitive search for the name of the request:
- All of the requests found in this particular instance were performed in the previous thread group, so therefore this entire category can also be deleted:
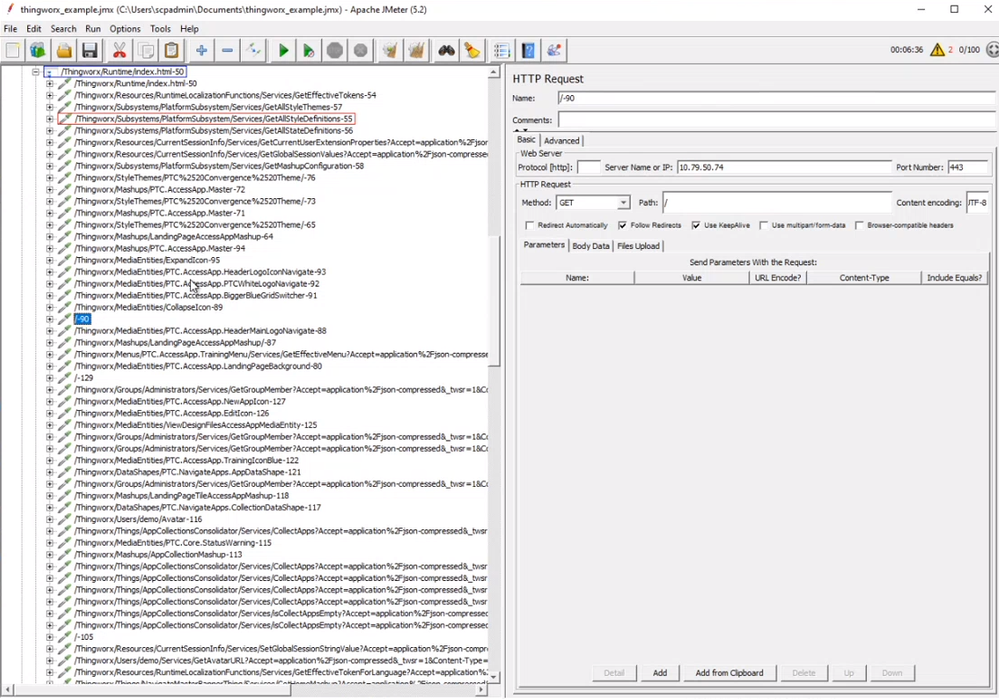
- Another odd thing you may see (if you do not use a Request Filter with the recording feature) are “blank” requests like these:
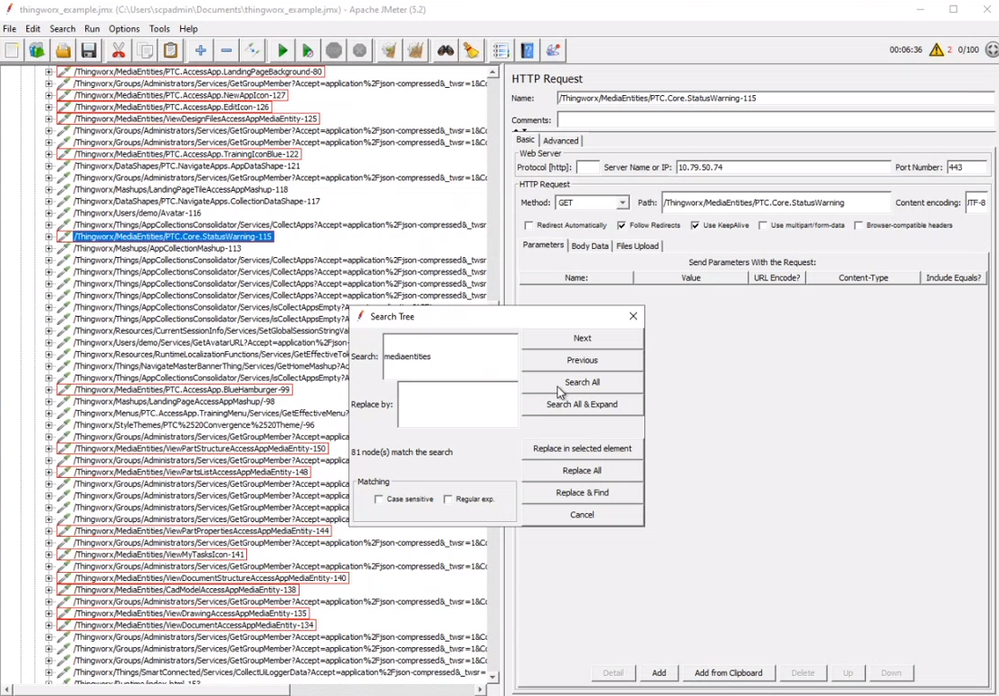
The recorder isn’t sure what to call these “non-requests”, so anything like this that isn’t an actual URL within the target application should be deleted. - Static downloads should be disabled or deleted from scale testing since they are usually cached by the user browser client. In this ThingWorx example, there are static “MediaEntites” which can be deleted or disabled:
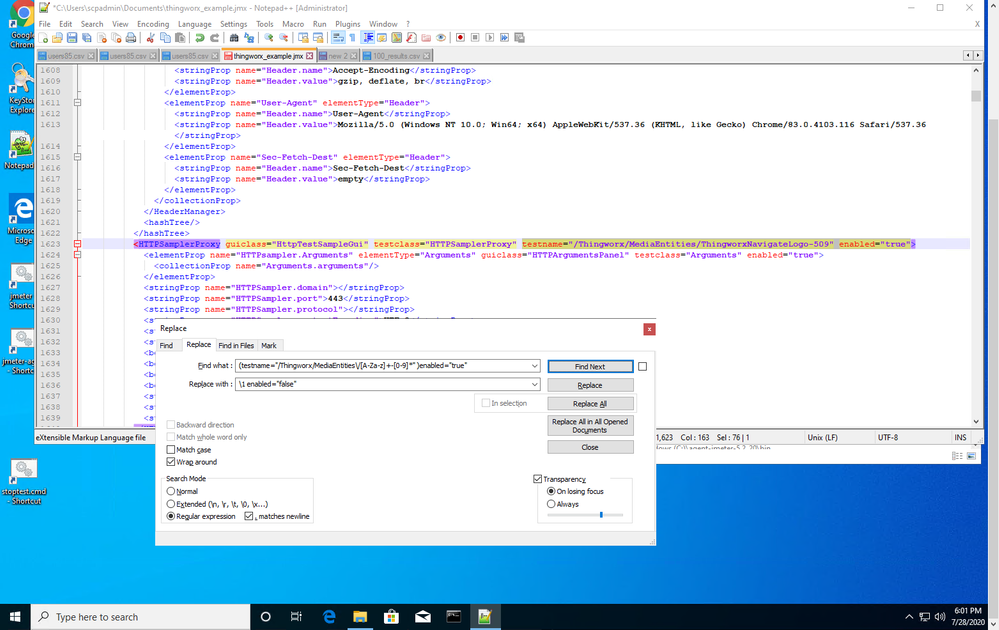
Within the JMeter client there is no good way to highlight and reset them all at once, unfortunately. The easiest way to remove all of these at once is to open the JMX file in a text editor and use regex expressions for search and replace “enabled=true” with “enabled=false”.
Most text editors have examples on how to use regular expressions within their Help topics. The above example is for Notepad++.
Parameterize Thread Groups
Parameterization is usually the part of creating a JMeter test that takes the most effort and knowledge. Some requests will require the same information for every thread, information which can therefore be defined statically within the JMeter element rather than being parameterized. Some values used within the JMeter test script can be parameterized as inputs in the top level of the test controller, for example: Duration, RampUp time, ApplicationHost, ApplicationPort.
Other values may be unique to only one thread group and could be defined in a User Defined Variables element within that group controller. The value(s) used within a request can also be determined on the fly by the results of earlier requests within a thread group. These request results typically must be post-processed and parameterized for later thread elements to function correctly.
The highest level values that are unique to each thread should be inputs from a CSV file that are passed into the threads as parameters, for example Username and Password. Data used within the test is usually parameterized in order to better emulate real world application use by multiple users. In the following example, we will parameterize the number of users for each thread group by adding a user- defined variable.
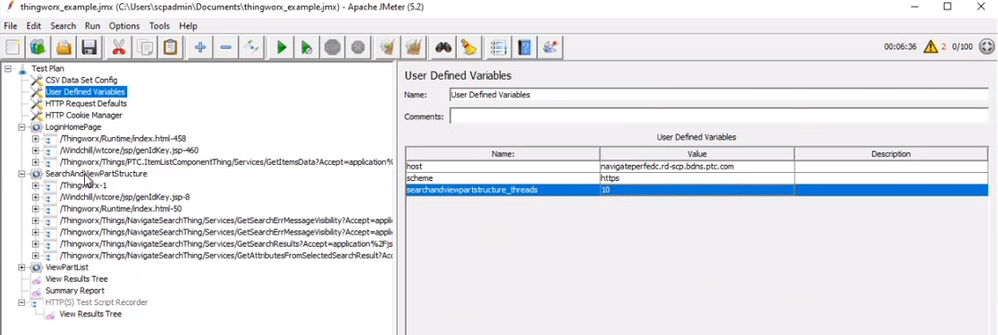
- Start by selecting the new thread group and parametrizing the number of threads (i.e. the number of users accessing this mashup at a time during the test). The way to enter a variable is with syntax like this: $(searchandviewpartstructure_threads)
- In this case, make this a user defined variable:
or a variable for the whole project, by highlighting “Test Plan” and adding the information there. - Begin looking at the samplers to see what types of things need to be parameterized in your test. Consider such things as: thread count (as shown above), ramp up time (also depicted above), duration, timings, roles, URL arguments, info table information, search result information, etc.
Another example here parameterizes the search parameters for a query by adding an overall search string column to a CSV file (which can then be randomly generated by some other script):
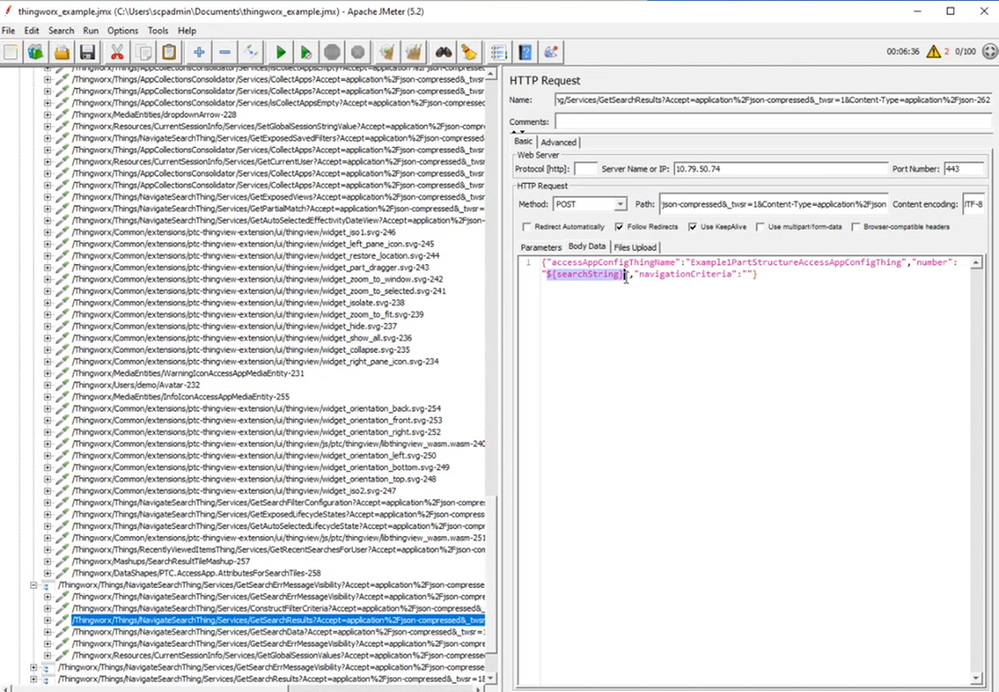
- First, parameterize the body data of the request by highlighting the request, and changing the value of the desired field to something like this: $(searchString)
- Next, define the parameter under the Test Plan and set a default value:
- Now define the searchString column again as part of the CSV Data Set:
Now it can be varied simply by providing different pseudo-random values with wildcards and/or known values in the CSV file.
Post Processors and Extractors
Most JMeter load tests become more complex when the results of one request are sent as parameters into later requests. This is done in JMeter by using Post Processors (Extractors), tools which facilitate extracting information out of the request results so it can be assigned to JMeter parameters.
There are many different types of extractors which can process the results of previous requests:
- CSS Selector Extractor – commonly used extractor for values returned as html attributes
- JSON Extractor – processes JSON objects using regular expressions
- BeanShell Post Processor –facilitates using code scripts to process return text when needed
- Regular Expression Extractor – JMeter supports use of regular expressions on request results
The JSON Extractor can be used to find and store information like the partOID number for a Windchill part as a parameter in JMeter, which can then be used to build more realistic workflows within the JMeter test. The example below steps you through setting up a JSON Post Processor.
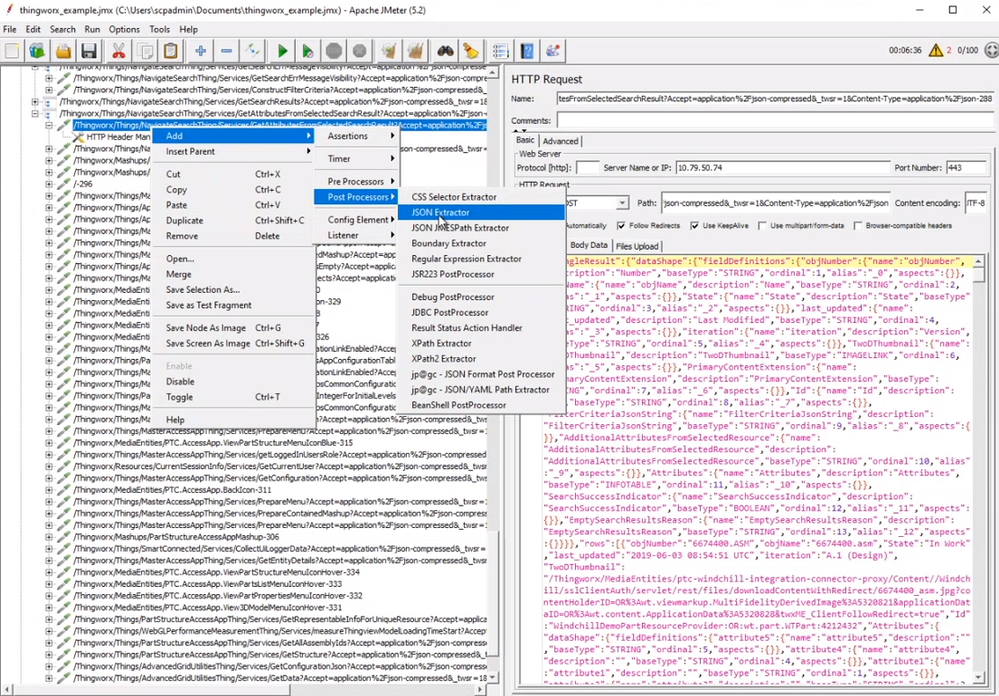
- Start by right-clicking the request that contains the results of our search. Then click “Add” > “Post Processors”> “JSON Extractor”, as shown in the image below:
- The extractor will now show up under that request as a sub-menu item. Select it, and name the variable something easy to reference. For the JSON Path expressions, pull the object number or some other identifying characteristic out of the search results: $.rows[0].objNumber for example.
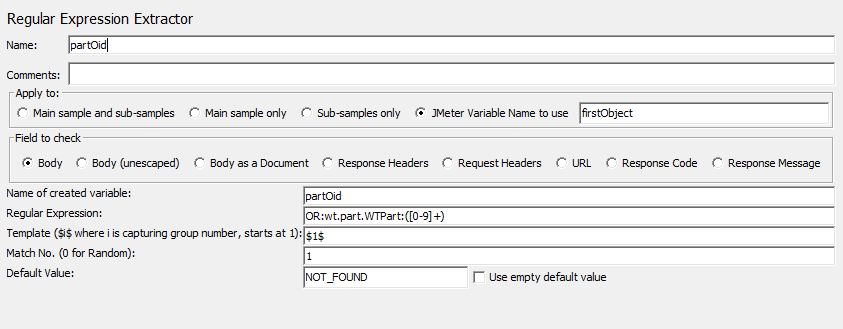
- Another option would be to take information like the partOID number send that into the search string field, by defining both as properties and having one refer to the other. To pull the partOID out, use a Regular Expression Extractor:
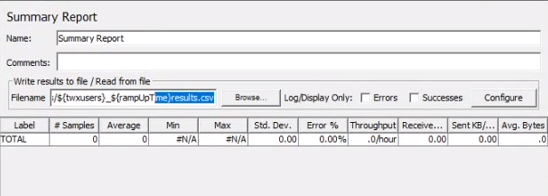
Another thing to parameterize is the summary report result file name. Adding in the number of users and ramp up time can result in files that are easier to reference later being stored on your machine. We will cover generating and reviewing Summary Reports in full in the next article in this series.
Conclusion
In this article we saw how to create new thread groups, removing extraneous requests from those groups, and reduce the overall ambiguity of which thread groups are representing which processes or mashup calls. We also covered how to parameterize the individual requests as well as the summary report. Note that things like Windchill URL and hostname, search parameters and part IDs, timings, durations, offsets, anything at all that influence the results of the test, should not be hard-coded. It is better to create variables for these things to ensure that all of the various simulated activities are configured in the exact same way every time. That way, the system can be tested again and again under various strains and loads until the capabilities of the application are verified.


