- Community
- IoT & Connectivity
- IoT & Connectivity Tips
- JMeter for ThingWorx
- Subscribe to RSS Feed
- Mark as New
- Mark as Read
- Bookmark
- Subscribe
- Printer Friendly Page
- Notify Moderator
JMeter for ThingWorx
JMeter for ThingWorx
Overview
Apache JMeter is an open-source tool designed for load testing and measuring the performance of a web application. JMeter has a wide range of features to facilitate this testing, including support for a variety of server and protocol types, a full-featured testing IDE with the ability to record the test steps from both a browser or a native application, and built-in debugging tools. Information about JMeter can be found on Apache’s website.
Working with JMeter is not always intuitive, but it also isn’t that much harder than regular software development. Take some time to explore the official Apache JMeter Documentation and figure out where things go and how to mechanically make use of the JMeter IDE. Then step through this tutorial to create a basic test that logins to ThingWorx, accesses a mashup, and clicks on a few widgets. This is the first in a series to come, courtesy of IoT EDC Engineer Tim Atwood ( @atwood ) and the whole EDC team.
Installation
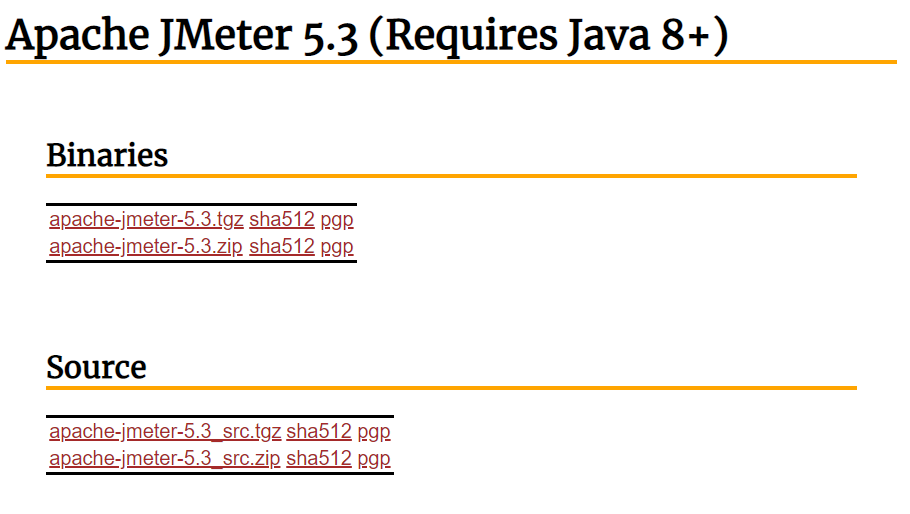
- Download JMeter from Apache’s website.
- Unpack the archive and copy the files to a desired location.
- Run the application by double clicking on the “ApacheJMeter.jar” file within the bin directory.
- JMeter is now installed and ready to use.
Creating a Test
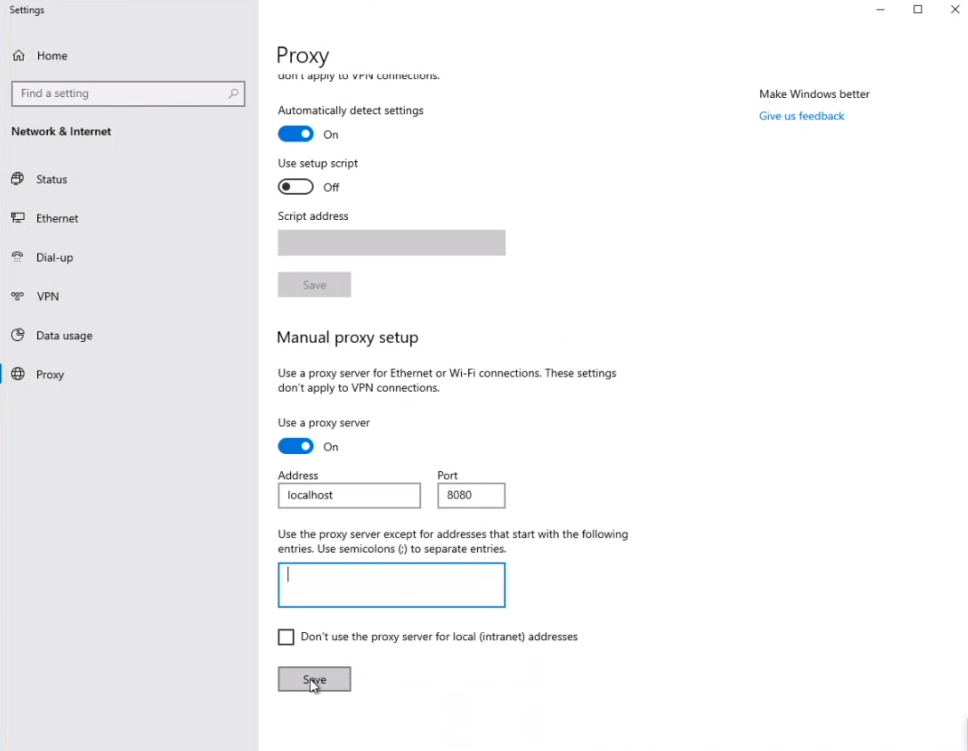
- Set up a proxy in your browser of choice (or on the OS in settings).
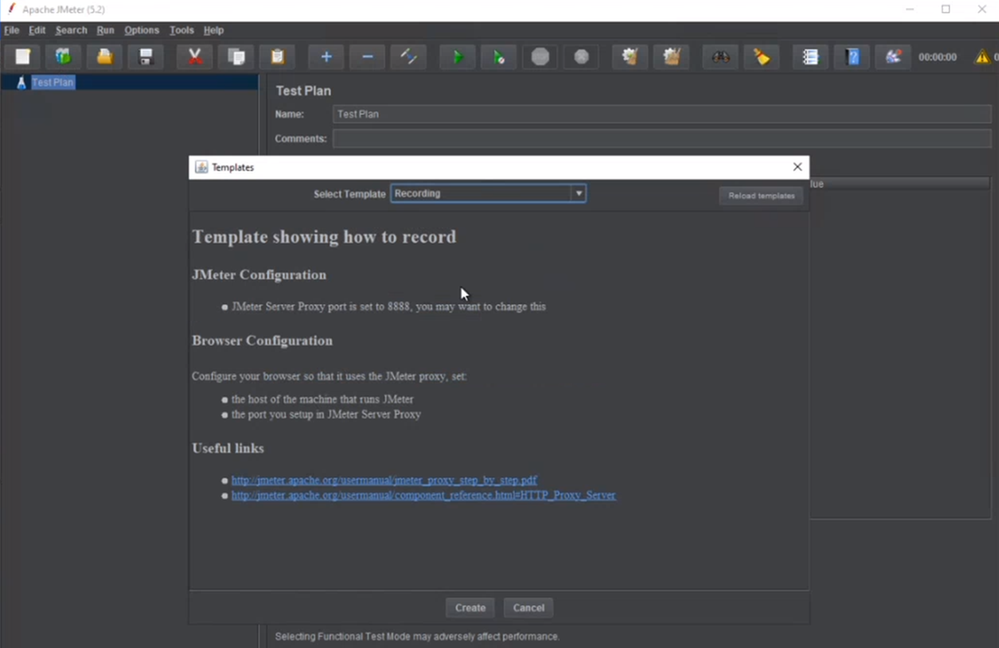
- Select the green “templates” icon in JMeter, and then select “Recording” for the template.
- Configure the recording template to point towards your ThingWorx Navigate or Foundation server, then click “Create”.
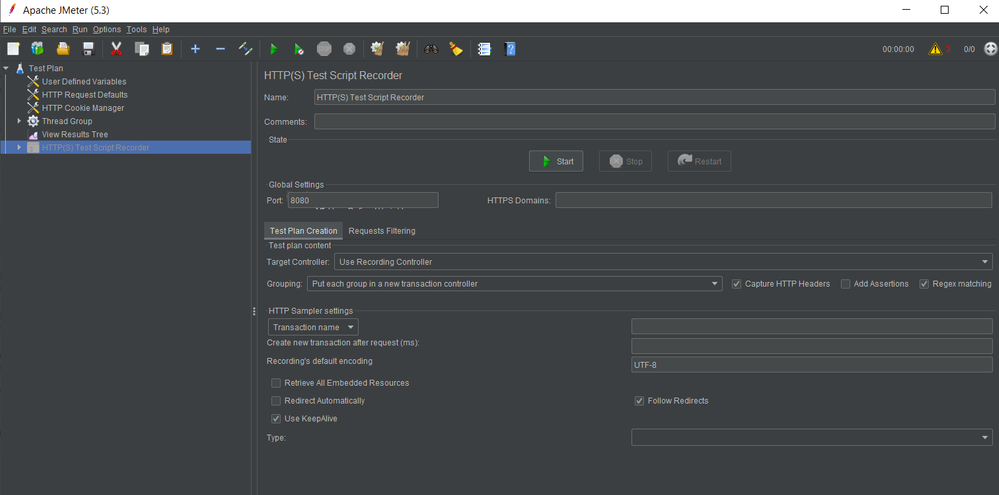
- Hit “Start” under the “HTTP(S) Test Script Recorder” tab of the new JMeter project. Make sure the port is set correctly under Global Settings.
- A pop-up box will appear that always stays visible on top of the active browser window, so that the recording can be controlled and stopped at any time. Leave the “Transaction name” field empty so that each transaction recorded by the software is automatically named after the web request (this helps differentiate one from the other, and they can each be renamed later).
- Open your browser, and navigate (via direct URL if possible, to keep things simple) to the mashup you wish to test. Login and let the page load.
- Click on anything you’d like on the mashup to capture the activity of that test.
- Then click “Stop” on the pop-up recorder window to stop the recording.
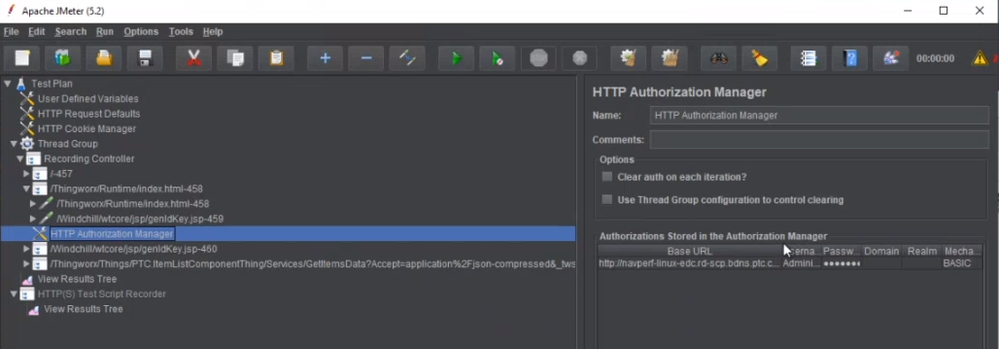
- Each transaction will be assigned an index as well, and the source code behind each of these transactions can be reviewed and manually modified in the main JMeter window. Here is the login request for instance:
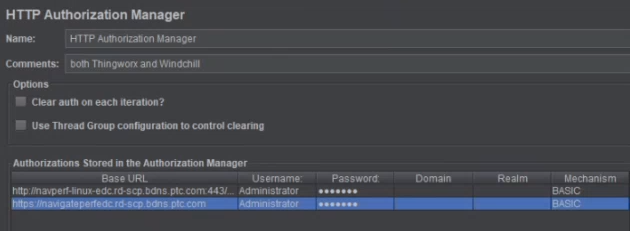
- The HTTP Authorization Manager is used to automatically authorize a defined user login for the thread to any of the Base URLs listed. In this case, though, there are two separate servers being accessed during the test, and one may need to be added manually:
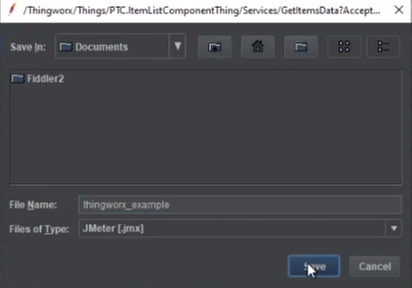
- Save the project before continuing, as manual modifications come next.
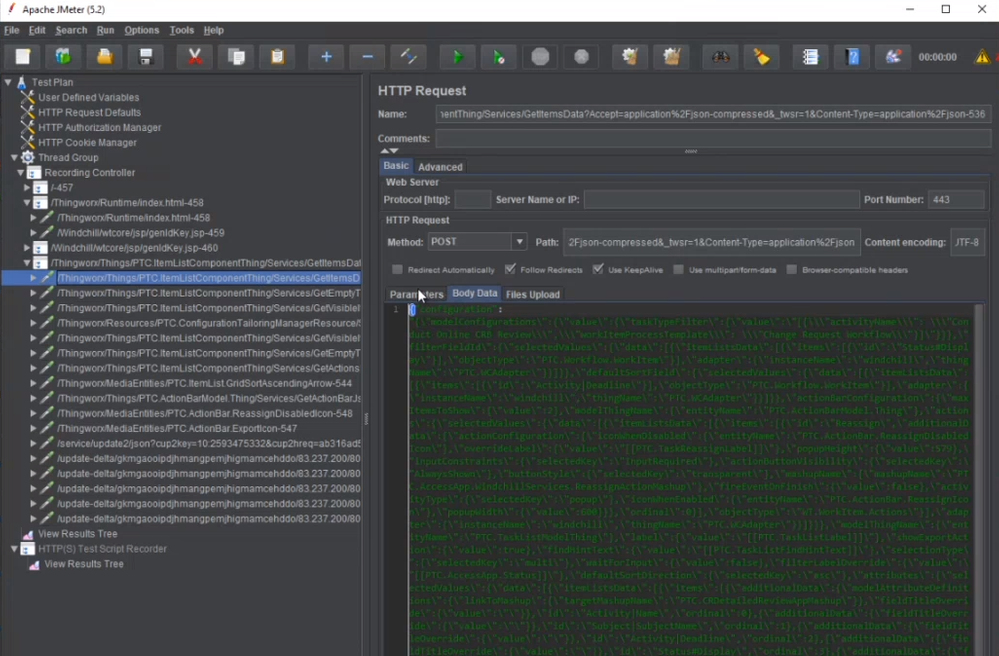
- Within the task page as you do the recording, a set of parameters or body data will be recorded. Modifying this is how you want to parametrize the test scenario, variables like the username and password. To simulate logging in as other users, you have to parameterize this, and not rely on the administrator account name and password entered into the browser.
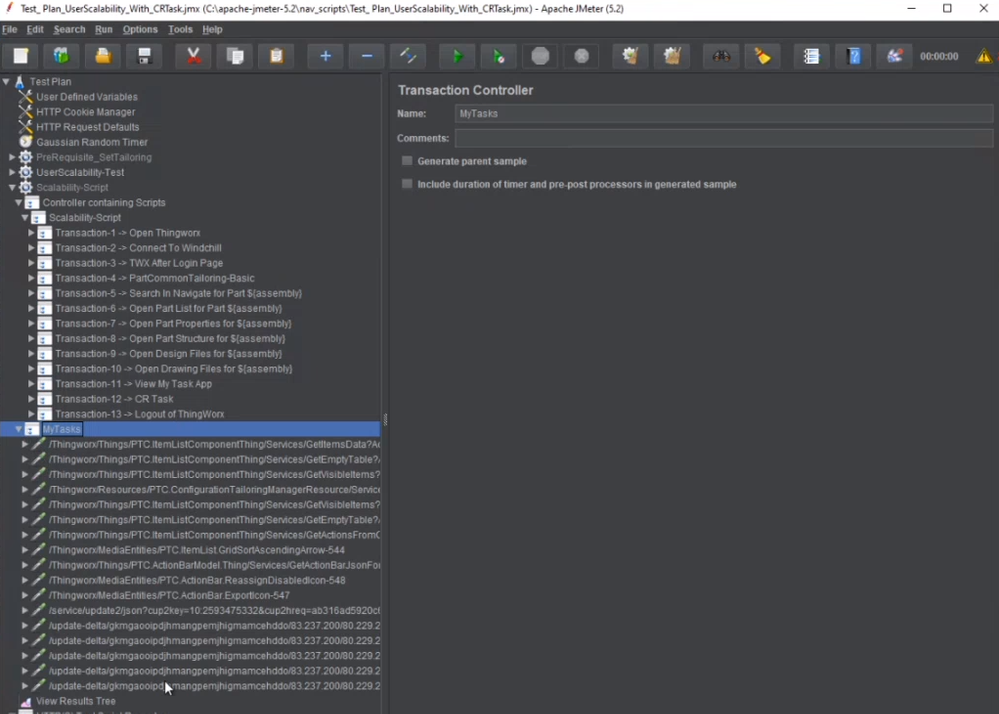
- Rename the task controller to “MyTasks” or something more easily identified than the long string it has now:
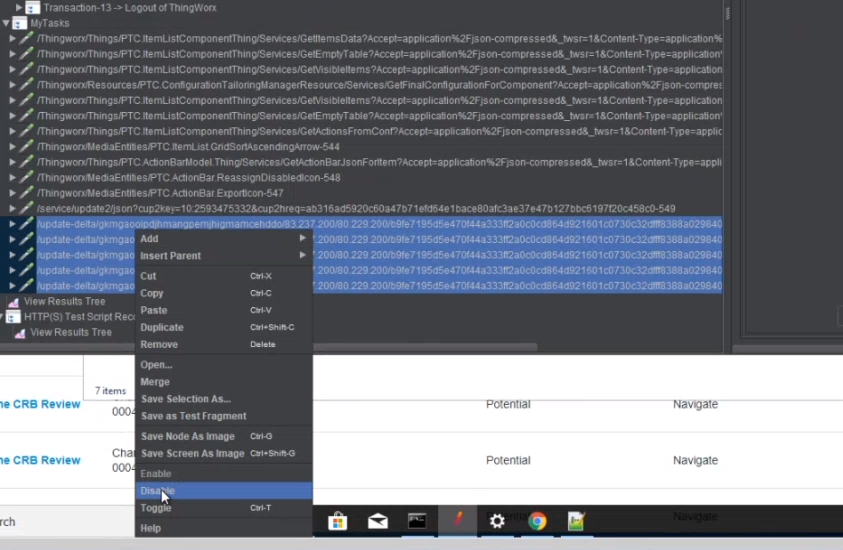
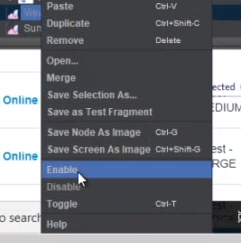
- Some recorded items like static images and stylesheets will be non-essential, things the browser processes for better graphical representation, but which are often cached and do not greatly affect the scalability results of the test. These can be highlighted and disabled all at once:
- Also ensure that any cascading stylesheets have been disabled.
- Enable the “View Results Tree” to ensure you can review the results of the test script during the editing phase. However, this “Listener” element has a high memory footprint during test execution, so it should be disabled before running an actual scale test.
- Next we need to parametrize the user login information and pull it from a csv file.
The colon means that “Administrator” is the default user to use for login.
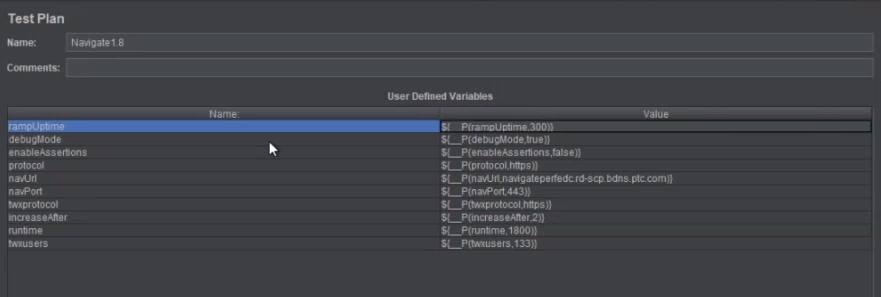
- You can add other properties as well, like ramp up time, run time, number of users, and protocols to use.
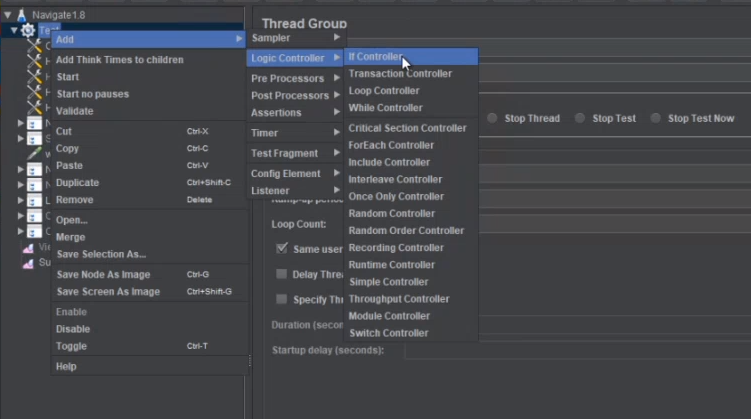
The ramp up time determines how quickly the threads are allocated for the test, which if done slowly enough, prevents the thundering herd scenario. - In more complex scenarios, logic controllers can be inserted to control the flow of the test. This allows for options such as if-then conditions for different user permissions, or parameter-based routes for better randomization of actions in different threads. This will be covered in more detail in a future article.
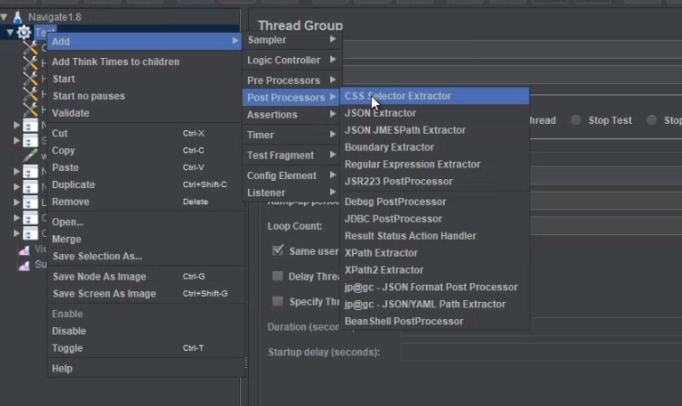
- Pre- and Post-Processors can be used as well, with the latter being used here much more than the former, to extract information from the response, in order to then use that as part of the variables going into one of the follow up requests.
For example, see the script in this image:This one has a variable that it extracts from the object number property, defined in the CSV file, and converts it into another variable that is used in subsequent scripts.
This script uses the object number reference to pull the name out of the body data and make the request, which is then post-processed by a bunch of these extractors. One is a JSON extractor which is trying to get an ID out of the JSON response. There is a regular expression extractor and a bean shell post-processor, which populates some variables based on what it responded with. Once it extracts all of the variables from the response to this particular request (GetSearchResults in this case), it then tailors the additional requests based on these.
-
- Customize the script according to the needs of your own application. Alternate between recording and manually modifying the recording code to ensure the test performs exactly as required and from the perspective of different users with different permissions. Also vary the type of activity performed on the mashup.
- Highlight the “View Results Tree” tab and click the green start button at the top of the window to see the results appear.
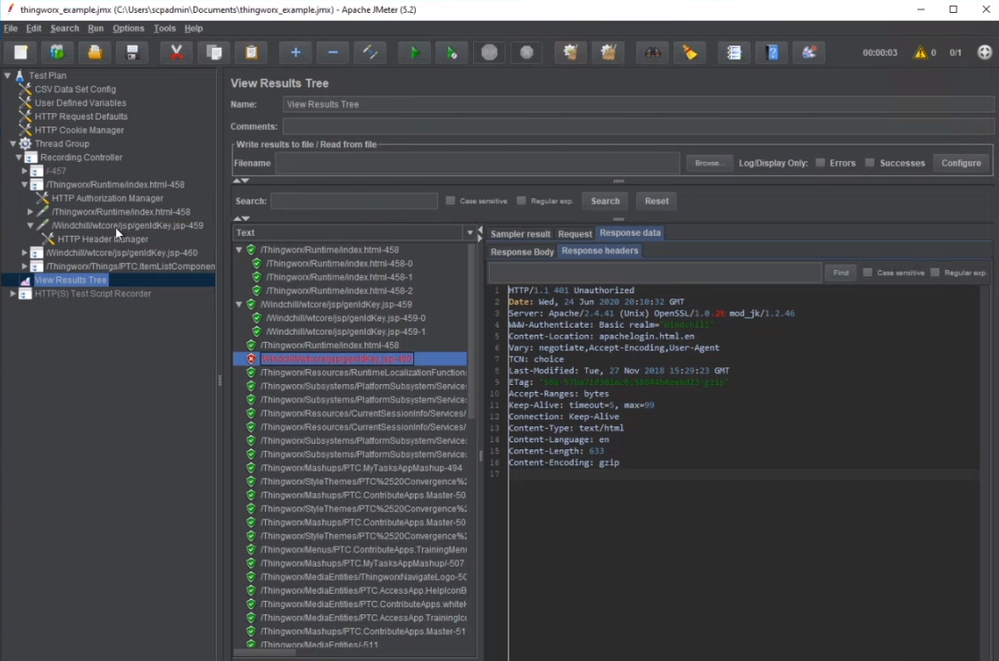
- If you are getting an unauthorized message, ensure that the scope is right for the login information, which may require moving the “HTTP Authentication Manager” component around in the project. Be sure to check the URLs and credentials entered for each type of user.
Occasionally the recorder will insert a long authentication string into the URL, and you want to manually set the URL for the credentials to the most generic URL possible for the server.
This can be parametrized too:
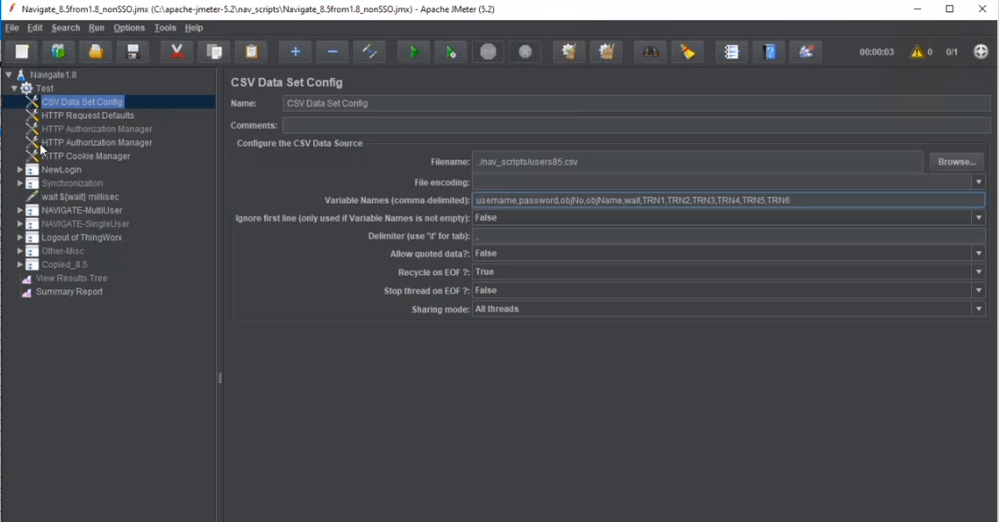
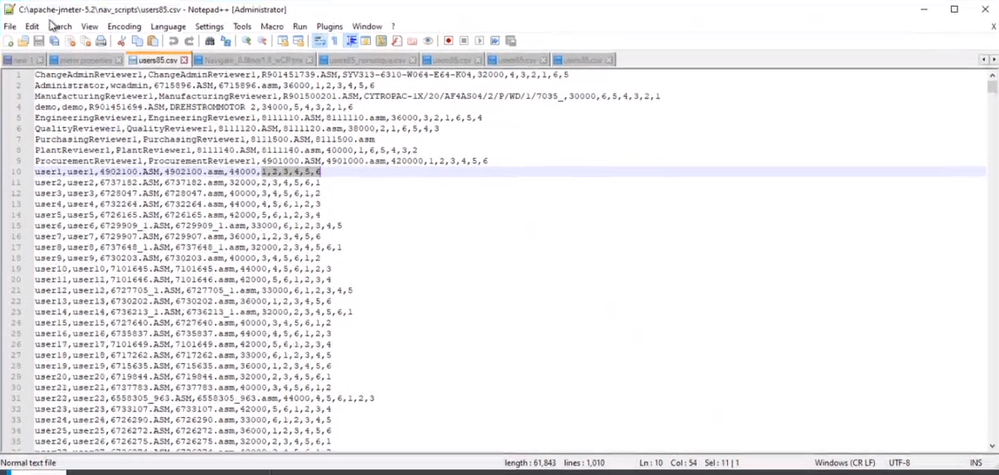
Referencing the CSV file defined here:
Which looks like this for a more complicated scenario (covered in the future):
The columns here represent the username, password, object number in Windchill, and object name in Windchill, as well as the wait time used to vary the way the logic is executed and some extra variables which differentiate for the switches what to do to create a more varied and realistic test.
Conclusion
Following these steps again and again on the various mashups throughout an application can ensure that a script for each web page and each type of user on each web page is created and added to the testing suite. This results in a load test that is perfectly representative of the real-world user load placed on an application. Load testing is a critical part of the development lifecycle in any application, and ThingWorx is no exception. Any further questions about the capabilities of JMeter not covered here, can be answered by the whole JMeter user manual, found on the Apache website.
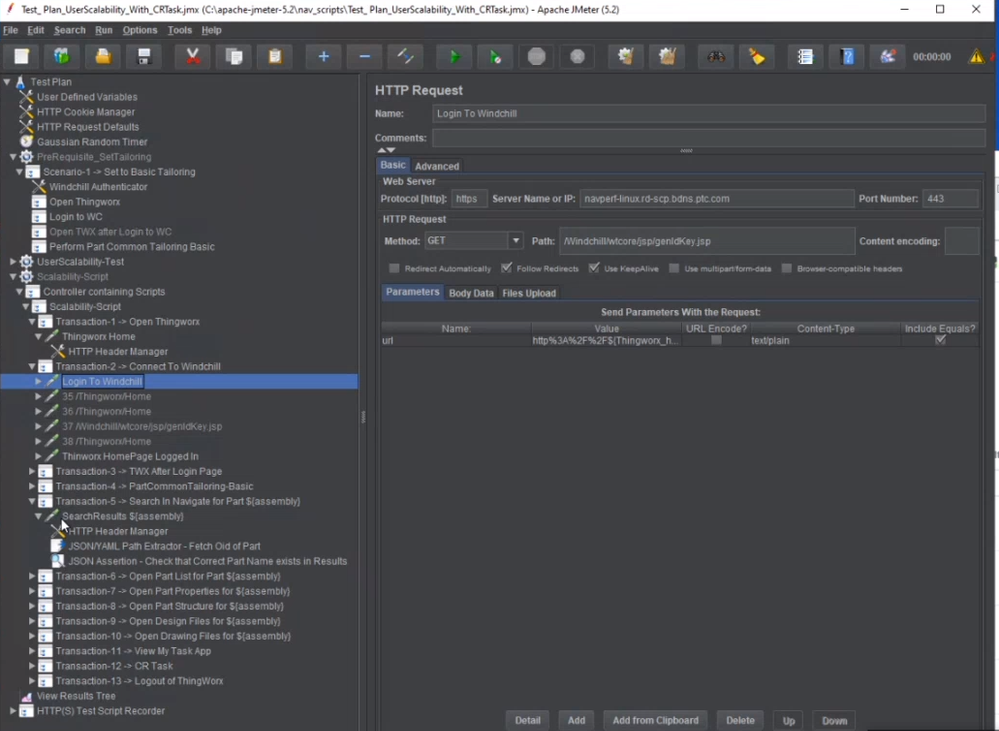
Future articles will include some basic scripts that test basic things, which can serve as an example for more complex ThingWorx JMeter script development. Here is an example of one tool PTC uses for internal QA of ThingWorx, designed to load test a Navigate application (specifically its built-in mashups):
Something similar to this tool may be available for public use later this summer. In the meantime, feel free to use the tutorial above to create scripts of your own. Any issues building your custom load tests in JMeter can be discussed right here on this thread with our JMeter experts. Happy developing!
- Mark as Read
- Mark as New
- Bookmark
- Permalink
- Notify Moderator
Thank you @ttielebein and the EDC team!
We were indeed missing a good hint about what tool to use for sizing tests.
I had a very similar version of such a JMeter script, but what I see here it is the proper thing.
Awesome!
- Mark as Read
- Mark as New
- Bookmark
- Permalink
- Notify Moderator
Hi,
It would be great if you share an example Test Plan file which is mentioned in the guide. It will help to understand the setup with the example Test plan file to see the setup and learn the first stress testing set up of JMeter for PTC product or customer-created app easily.
Many thanks,
Rahul


