- Community
- IoT & Connectivity
- IoT & Connectivity Tips
- ThingWorx Performance Monitoring with Grafana
- Subscribe to RSS Feed
- Mark as New
- Mark as Read
- Bookmark
- Subscribe
- Printer Friendly Page
- Notify Moderator
ThingWorx Performance Monitoring with Grafana

authored by EDC team member Desheng Xu ( @xudesheng )
Monitoring ThingWorx performance is crucially important, both during the load testing of a newly completed application, and after the deployment of new code in an existing application. Monitoring performance ensures that everything works as expected at the Enterprise level. This tutorial steps you through configuring and installing a tool which runs on the same network as the ThingWorx instance. This tool collects data from the Platform and translates it into something visual and easy to understand via Grafana.
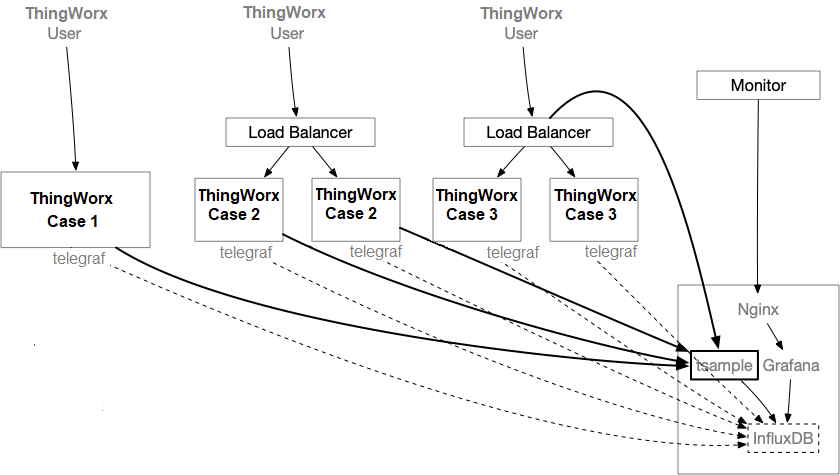
tsample is small and customizable, and it plays a similar role to telegraf. Its focus is on gathering ThingWorx performance metrics. Historically, this tool also supported collecting OS level performance metrics, but this is no longer supported. It is highly recommended to collect OS level performance metrics by using telegraf, a tool designed specifically for that purpose (and not discussed here). This is not the only way to go about monitoring ThingWorx performance, but this tool uses a very good approach that has been proven effective both at customer sites and internally by PTC to monitor scale tests. Find the most recent release here.
Recommended Deployment Architecture
tsample can be deployed in the same box where ThingWorx Tomcat is running, but it's recommended to deploy it on a separated box to minimize any performance impact caused by the collector. tsample supports export to InfluxDB and/or local file. In this document, it is assumed that InfluxDB will be used for monitoring purpose. Please note that this is not the same instance of InfluxDB being used by ThingWorx (if configured). This article will not cover setting up InfluxDB or NGINX (if necessary), so please configure these before beginning this tutorial.
Supported Platform
tsample has been tested on Windows 2016, MacOS 10.15, Ubuntu 16.04, and Redhat 7.x. It's anticipated to work on a more general Ubuntu/Redhat/Mac/Windows release as well. Please leave a comment or contact the author, @xudesheng , if Raspberry Pi support is needed.
Configuration File
Where to Store the Configuration File
tsample will pick up the configuration file in the following sequence:
- from the command line...
./tsample -c <path to configuration file>
- from the environment...
- Linux:
export TSAMPLE_CONFIG=<path to configuration file>
./tsample
- Windows:
set TSAMPLE_CONFIG=<path to configuration file>
tsample.exe
- from a default location...
tsample will try to find a file with the name "config.toml " from the same folder in which it starts.
How to Craft a Configuration File
You can use following command to generate a sample file:
./tsample -c config.toml -e
or:
./tsample -c config.toml --export
A file with the name "config.toml " will be generated with a sample configuration. You can then adjust its content in accordance with the following.
Configuration File Content
Format
Configuration file must be in toml format.
title and owner sections
Both sections are optional. The intention of these two sections is to support doc tool in future.
TestMachine section
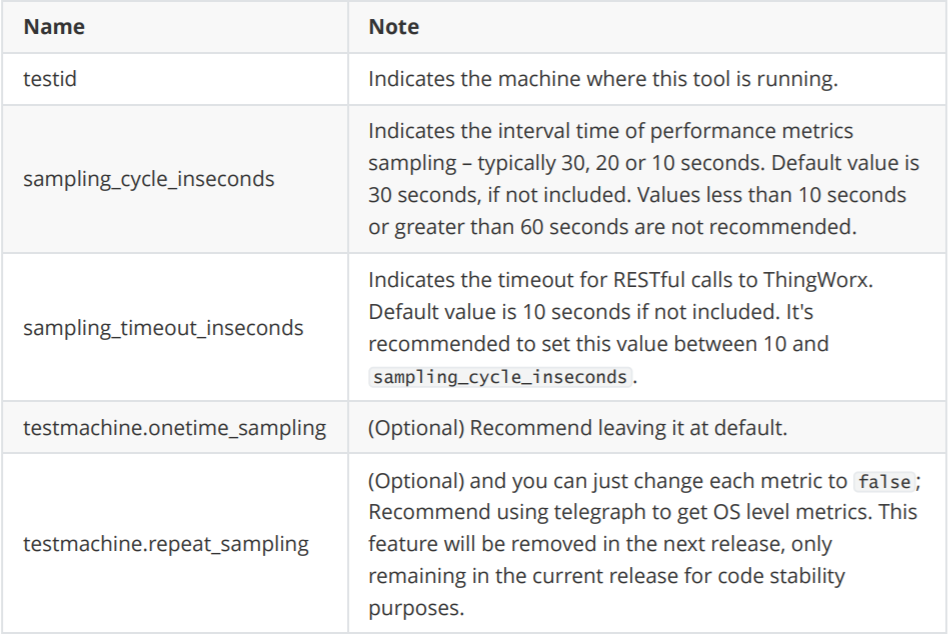
This is section is required, and it defines where this tool will run.
thingworx_servers section
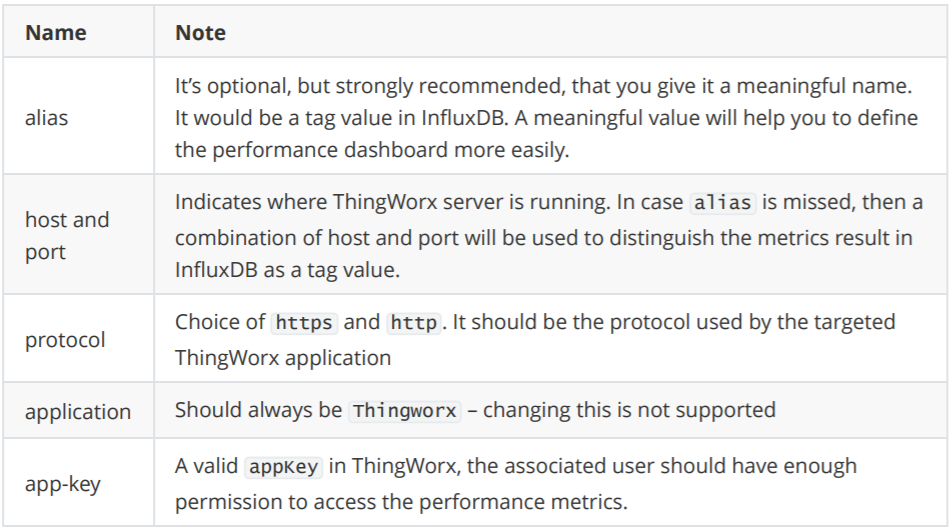
This section is where you define targeted ThingWorx applications. Multiple ThingWorx servers can be defined with the same or different metrics to be collected.
thingworx_servers.metrics sections
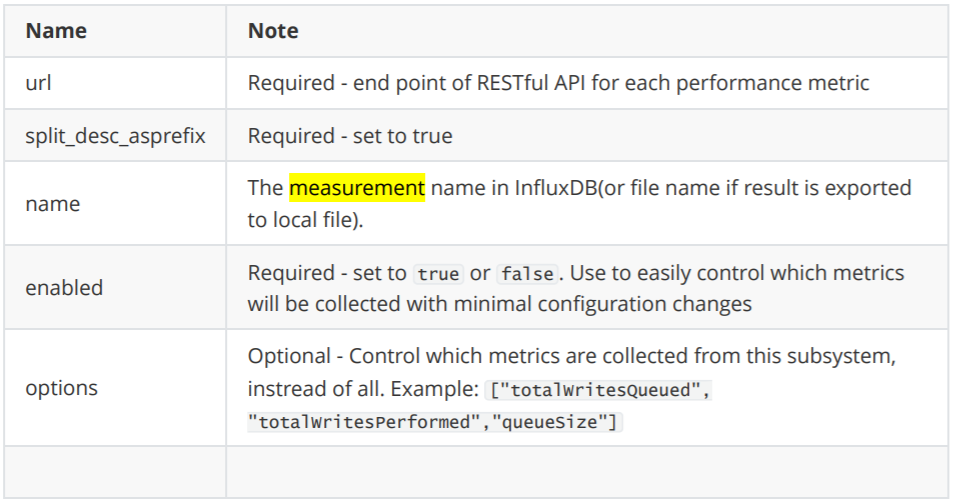
Underneath each thingworx_servers section, there are several metrics. In default example,
following metrics have been included:
- ValueStreamProcessingSubsystem
- DataTableProcessingSubsystem
- EventProcessingSubsystem
- PlatformSubsystem
- StreamProcessingSubsystem
- WSCommunicationsSubsystem
- WSExecutionProcessingSubsystem
- TunnelSubsystem
- AlertProcessingSubsystem
- FederationSubsystem
You can add your own customized metrics, as long as the result follows the same Data Shape. The default Data Shape has 3 columns:
If the output Data Shape exceeds this limit, the tool will likely not work properly.
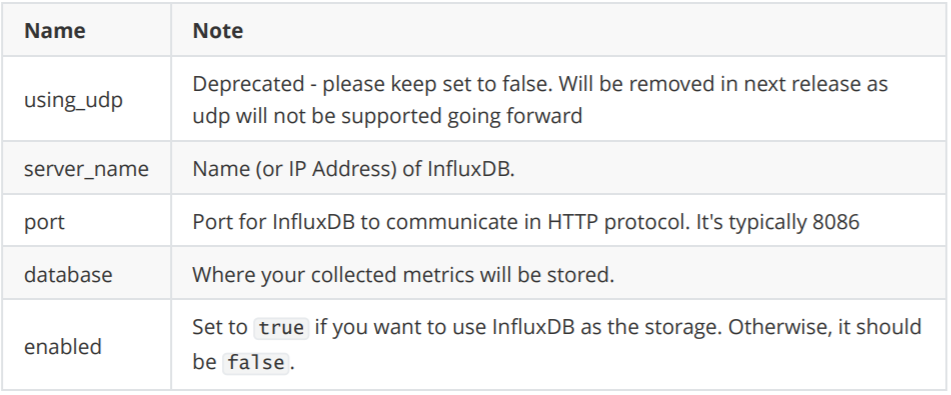
result_export_to_db section
This section defines the target InfluxDB as a sink of collected performance metrics.
result_export_to_file section
This section defines the target file storage for collected performance metrics.
Grafana Configuration Example
Monitor Value Stream
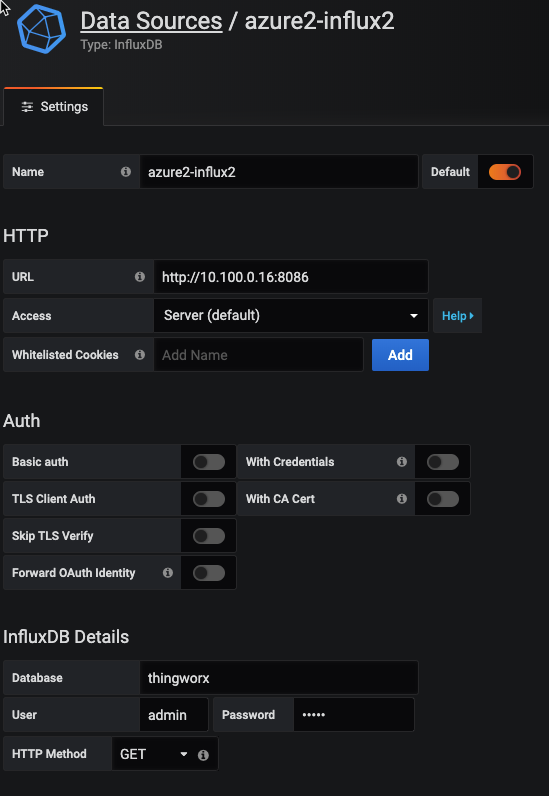
Step 1. Connect Grafana to InfluxDB
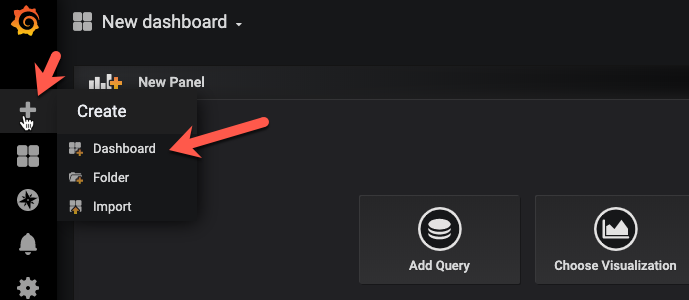
Step 2: Create a New Dashboard
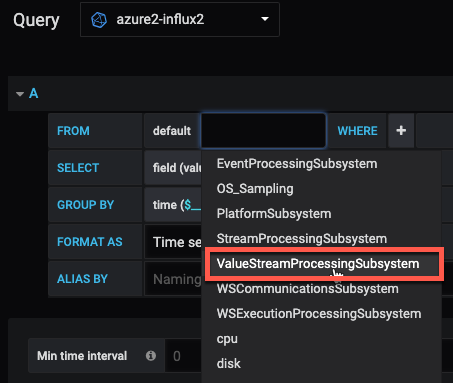
Step 3. Create a New Query
Depending on which metrics you defined to collect in the tsample configuration file, you will see a different choice of measurement in Grafana. Here, we will use ValueStreamProcessingSubsystem as an example.
Step 4. Choose the Right Platform and Storage Provider
Some metrics depend on the database storage provider, like Value Stream and Stream.
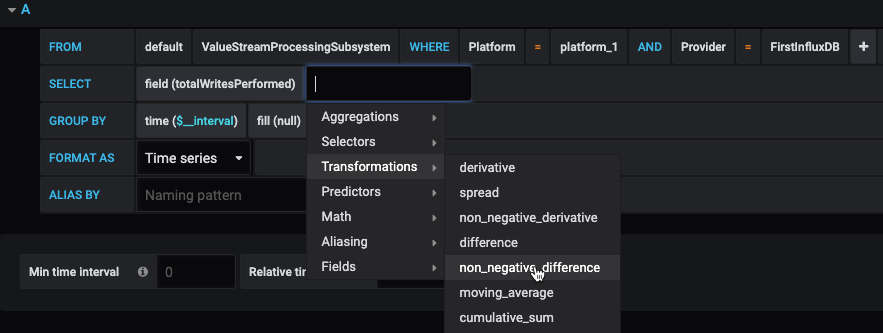
Step 5. Choose the Metrics Figures
Select "remove" to get rid of the default 'mean' calculation.
Select "non_negative_difference" from Transformations. Using this transformation, Grafana can show us the speed of writes.
Then, remove the default GROUP BY "time" clause.
Assign a meaningful alias of this query.
Step 6. Add Another Query
You can add another query as 'Value Stream Queued Speed' by following the same steps.
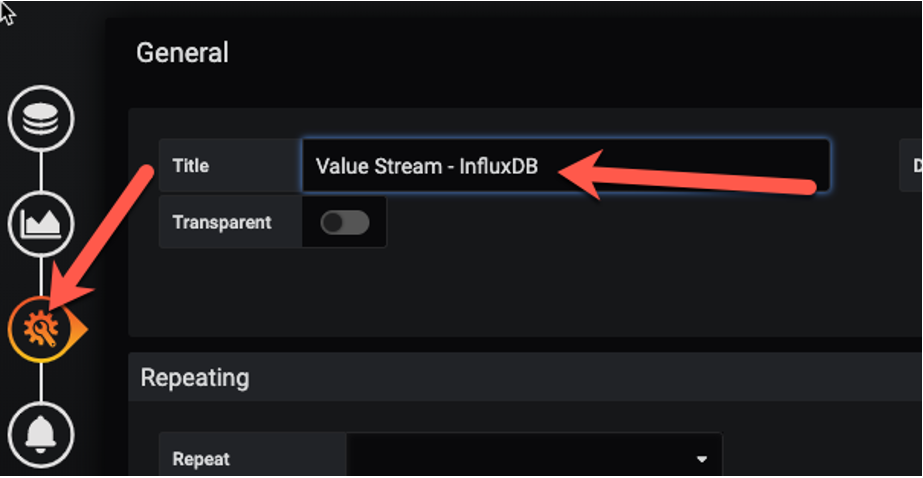
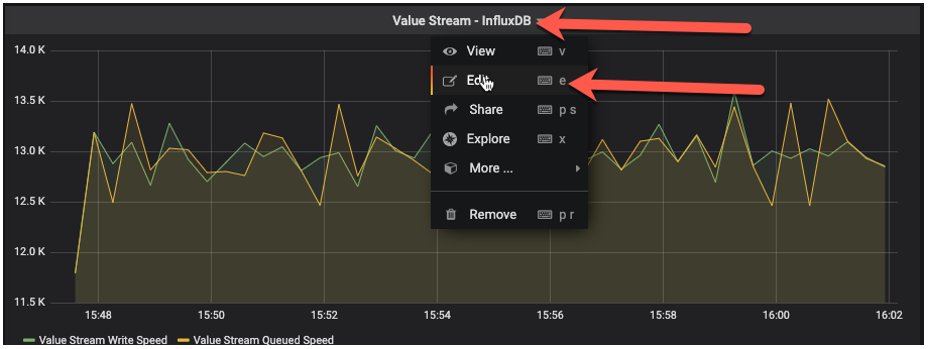
Step 7. Assign a Panel Title
Step 8. Review the Result
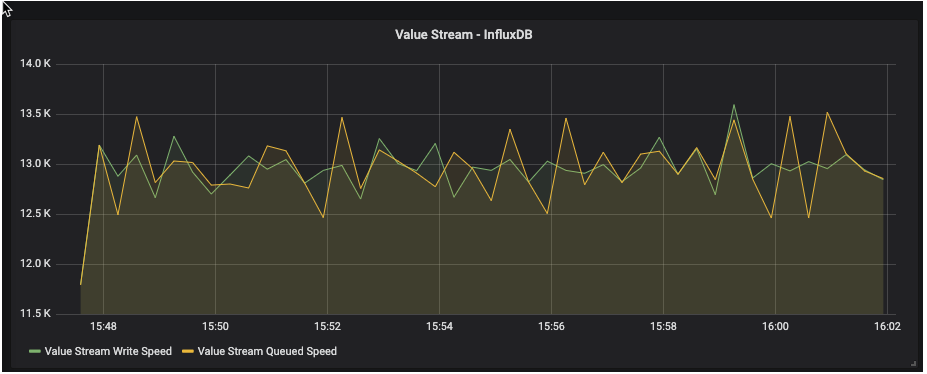
Let's go back to the dashboard page and select "last 15 minutes" or "last 5 minutes" from the top right corner. It should show a result similar to the chart below.
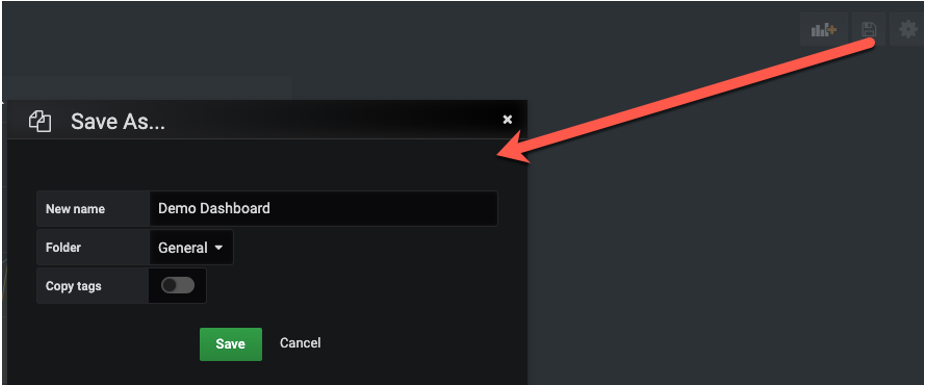
Step 9. Save the Dashboard
Don't forget to save your dashboard before we add more panels.
Step 10. Refine the Panel
It's difficult to figure out the high-level write speed from the above panel, so let's enhance it.
Add a new query with the following configuration:
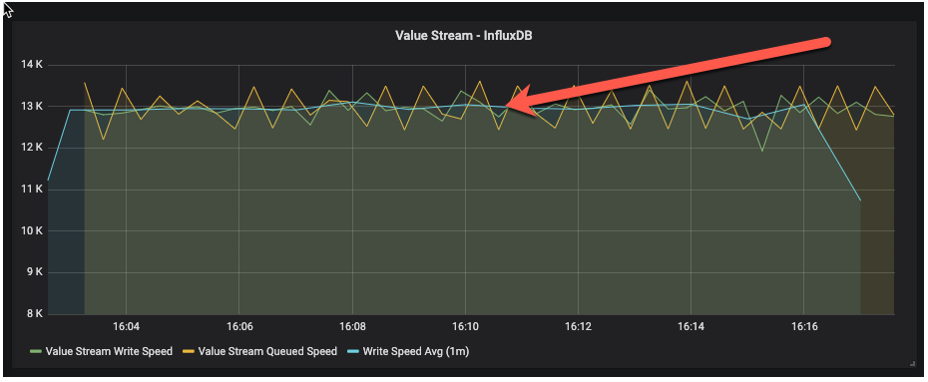
In the above query, there are two additional figures: 20s and 1m... How do you choose? 20s should be the same as sampling_cycle_inseconds in your tsample configuration file. If you choose a different value, then you could end up with misleading results.
Larger values such as "1m" may give you a smoother result, but they could also hide system instability. Going larger than 1m is not recommended in most cases.
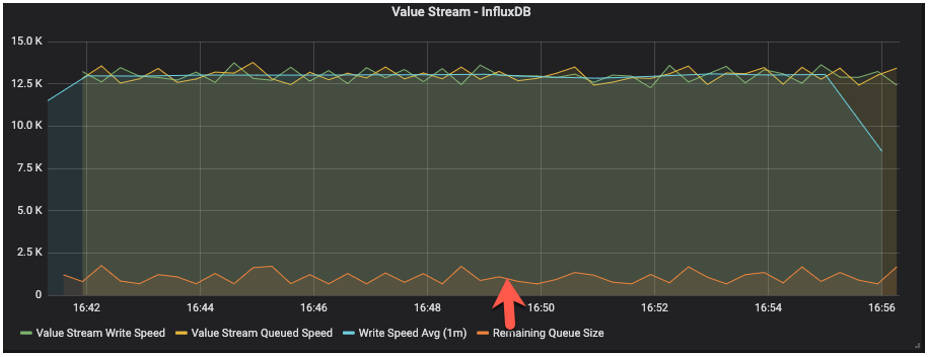
With this new query, it's much easier to figure out what the average write speed in current testing is.
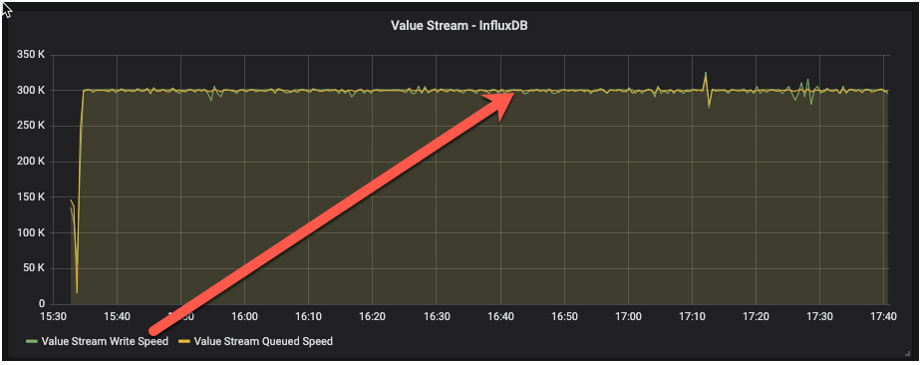
Tips: if your sampling_Cycle_inseconds is 30s, then you may not need this additional query. The following image is a sample at the 30s interval time. You would not need an additional average query to get a smooth write speed.
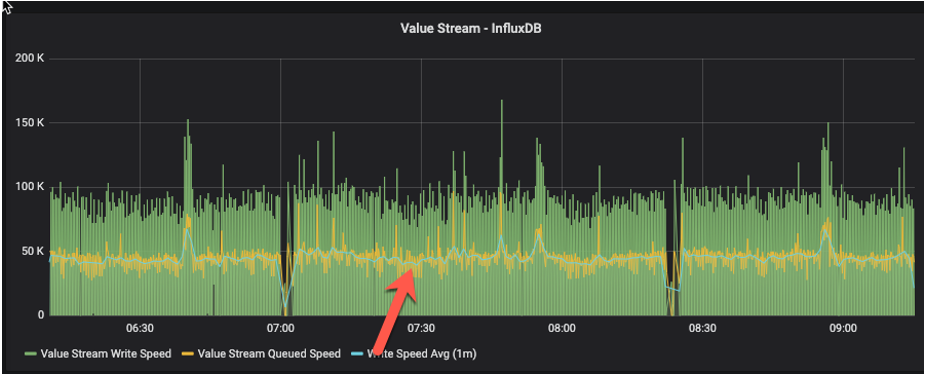
The next example is a sample at the 10s interval time. Without additional queries, you may not be able to get a meaningful understanding of the write speed.
From the above three examples, it's recommended to configure the sampling interval time at 30s, or anything larger than 20s. You can then choose whether you need additional queries based on the visualization result.
Step 11. Further Refinement
The above charts illustrate the queuing and writing speed. However, it is possible that the Value Stream may perform at a reasonable speed, but the Value Stream queue may be growing and could exceed its capacity. Let's add another query to monitor this:
However, it is difficult to read this chart, since it has a different value range on the y-axis:
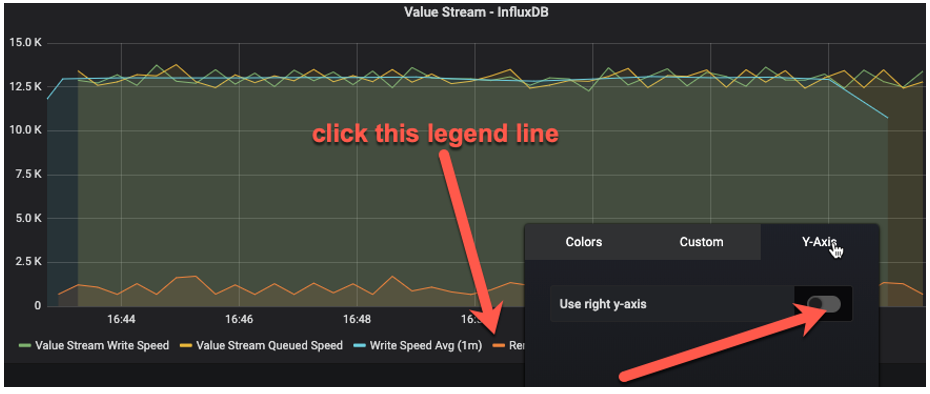
Let's move this query to a second y-axis on the right:
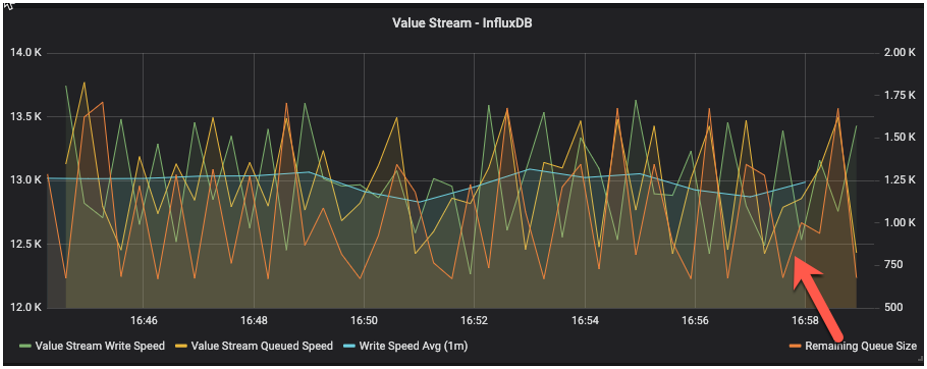
This will make the view much easier to see:
The current queue size or remaining queue size will always move up and down; it is healthy as long as it does not continue to grow to a high level.
What Else Can Be Monitored?
The following metrics would be monitored by most customers:
- Value Stream write and queue speed
- Value Stream queue size
- Stream write and queue speed
- Stream queue size
- Event performed speed (completedTaskCount)
- Event submitted speed (submittedTaskCount)
- Event queue size
- Websocket communication
- Websocket connection
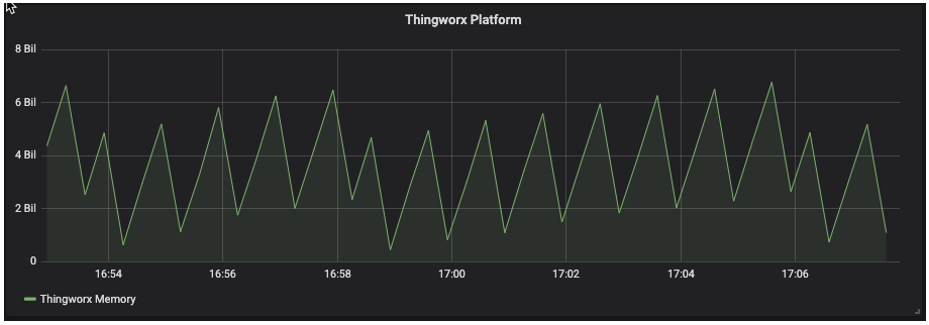
ThingWorx Memory Usage Monitoring
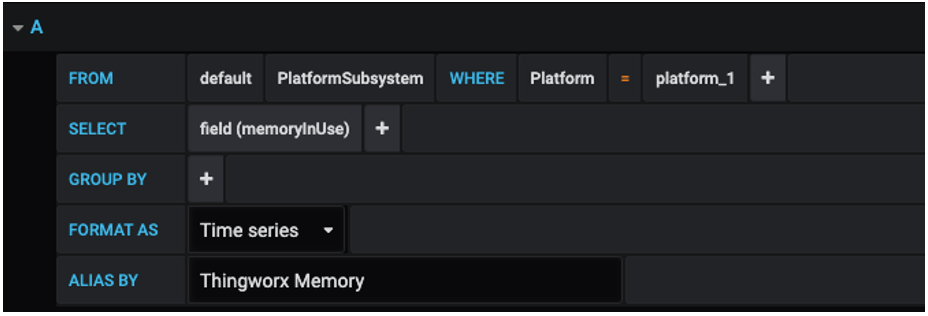
Create a new panel and add a new query:
In a running system, memory usage will always move up and down - at times sharply or quickly - when the system is busy. The system is healthy as long as memory doesn't go up continuously or stay at a maximum for a long period of time.
Conclusion
Setting up monitoring is absolutely crucial to managing the performance of an enterprise ThingWorx application. Using Grafana makes tracking and visualizing the performance much easier. Stay tuned to the EDC tag for more monitoring tips to come!
- Mark as Read
- Mark as New
- Bookmark
- Permalink
- Notify Moderator
Hi
It is great to monitor even Websocket connection!
I am wondering if it is just could cover time-series database performance - Influx database Or could watch the performance for a meta-data database like Postgres or MS-SQL?
- Mark as Read
- Mark as New
- Bookmark
- Permalink
- Notify Moderator
@DeShengXu can say for sure, but I do believe this works for these kinds of databases. InfluxDB is the database used in the example here.
- Mark as Read
- Mark as New
- Bookmark
- Permalink
- Notify Moderator
The 'tsample' tool itself is only designed to collect ThingWorx server metrics.
The telegraf agent is installed on the ThingWorx servers to collect operating system metrics. This can also be done on other servers in the environment (database servers, connection servers, etc)
You can search and find telegraf-based plugins for collecting PostgreSQL and MS SQL Server metrics. But this article does not focus there, and they are not tools that PTC supports.
Keep in mind, the InfluxDB instance discussed in this article is only for collecting metrics. It must be separate from InfluxDB instance used to hold ThingWorx Value Stream content. In production and production testing, the InfluxDB instances should also be on separate InfluxDB servers.
- Mark as Read
- Mark as New
- Bookmark
- Permalink
- Notify Moderator
Agreed. its actually great that we are able to monitor such. A lots of users are expecting the surprises ahead.
- Mark as Read
- Mark as New
- Bookmark
- Permalink
- Notify Moderator
Hi,
Thank you for pointing out the difference from the InfluxDB instance collecting metrics here and the InfluxDB instance used to hold ThingWorx Value Stream content. Actually I didn't realize that and confused with InfluxDB for ThingWorx Value Stream.
- Mark as Read
- Mark as New
- Bookmark
- Permalink
- Notify Moderator
Hi there
Very nice tool, everything seems to work fine :).
I only have three questions:
1. I am getting an error message, and I am not able to figure out what it means. Running on docker by the way. Can you help me with that?
2. You mentioned tsample is customizable. Is there any open source code of tsample? That would be very nice.
3. Is it possible to integrate the new Metrics endpoint of ThingWorx 9?
Kind Regards
mplieske
- Mark as Read
- Mark as New
- Bookmark
- Permalink
- Notify Moderator
Over the years, my colleague @xudesheng has adapted the approach explained here and has switched out three important parts.
- Telegraf metrics collection is replaced by Prometheus metrics scraping
- TSample ThingWorx metrics client is replaced by the /Thingworx/Metrics endpoint
- InfluxDB is replaced by Prometheus time-series database
I have made explanatory overview and how-to videos on how to set this (and more) up today. I've also included the resources for Grafana Dashboards, Exporter configurations, etc. so that you don't have to start from zero. More to come on this in 2022...
@CD_9725541 We are using Prometheus and Grafana as standard tools for monitoring and this will also apply to container based approaches.
@mplieske The approach explained here was established prior to the existence of the metrics endpoint; now we leverage it and no longer need the TSample client.
- Mark as Read
- Mark as New
- Bookmark
- Permalink
- Notify Moderator

