Community Tip - Learn all about the Community Ranking System, a fun gamification element of the PTC Community. X
- Community
- Creo+ and Creo Parametric
- 3D Part & Assembly Design
- Did You Know? PTC Creo 3.0 Enhancements: Performin...
- Subscribe to RSS Feed
- Mark Topic as New
- Mark Topic as Read
- Float this Topic for Current User
- Bookmark
- Subscribe
- Mute
- Printer Friendly Page
Did You Know? PTC Creo 3.0 Enhancements: Performing a Design Study in PTC Creo Simulate
- Mark as New
- Bookmark
- Subscribe
- Mute
- Subscribe to RSS Feed
- Permalink
- Notify Moderator
Did You Know? PTC Creo 3.0 Enhancements: Performing a Design Study in PTC Creo Simulate
With PTC Creo 3.0 you can quickly and easily determine how to optimize your models by performing design studies. In today’s post we will use a Global Sensitivity Design Study to study how the curved sides of the gear housing affect the maximum principal stress in the gearbox. Here, Mark Fischer, a PTC Creo Simulate Product Manager, explains how to run a design study and display the results graphically in PTC Creo 3.0:
To begin, click Analyses and Studies from the Run group to open the Analyses and Design Studies dialogue box. Note that a static analysis, Gearbox, has already been defined. PTC Creo Simulate will calculate values for all Measures that are valid for the analyses included in the study.
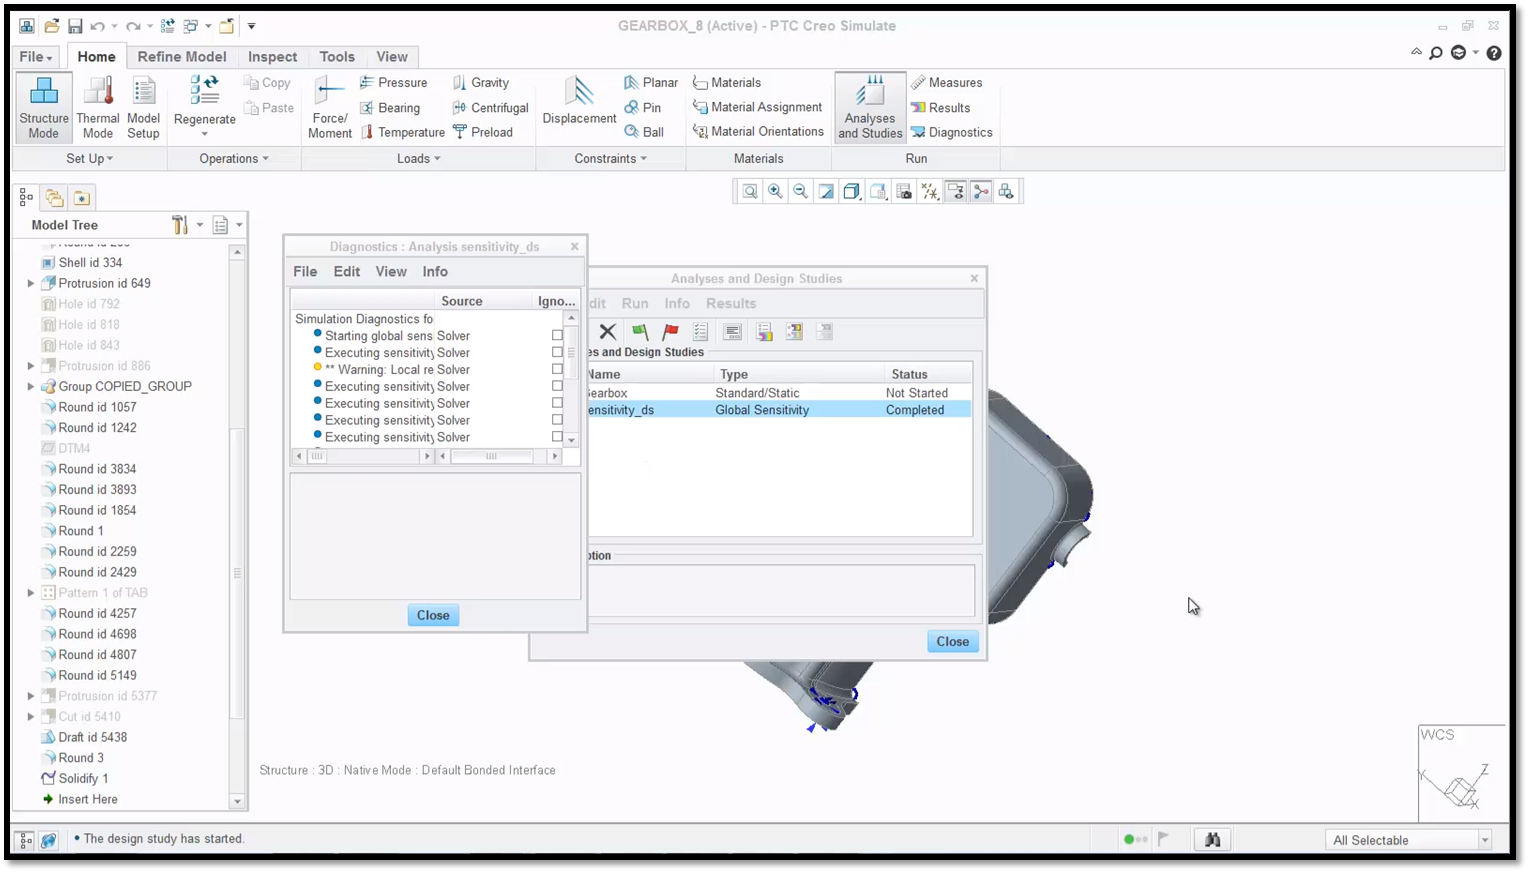
In the dialogue box, you will see a list of analyses and design studies that have already been defined.
To define the study, select New Sensitivity Design Study... from the file menu to open the Sensitivity Study Definition dialogue box. First, name the study, then verify that Global Sensitivity is the Type of study to be run. Select Gearbox (Static) as the analysis to include in the study.
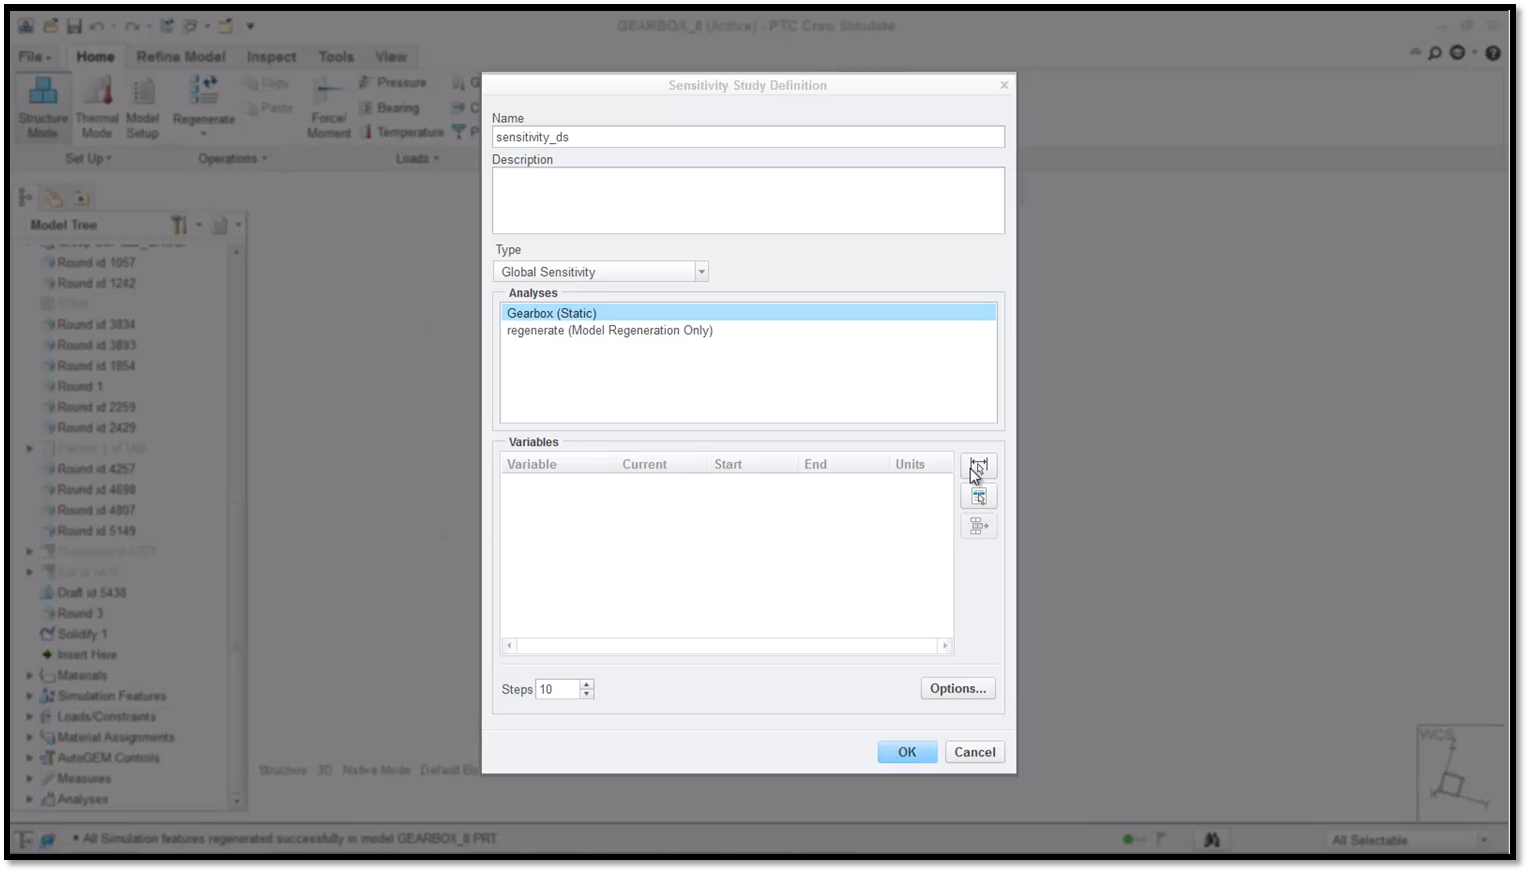
In this example, the study is named sensitivity_ds.
Next, click Select a Dimension to add a dimension to the variables table in the design study. Select the curved edges of the housing and the r8 dimension on the model as shown. If there is more than one dimension selected, PTC Creo Simulate varies the variables in sync, calculating a single set of variables for our model’s Measures at each interval. Edit the name of the variable by clicking it and typing a new name in the field. The Current field lists the current value of the variable in the model. The Start field allows us to select the current value or select the Start value for a variable. The End value allows us to select the current value or edit the current value for a variable. The End value must be greater than the Start value. The number of Steps defines the number of intervals that PTC Creo Simulate will use in the study. These intervals are distributed evenly across each design variable range and values are calculated at each interval for each Measure. Define your values and select OK.
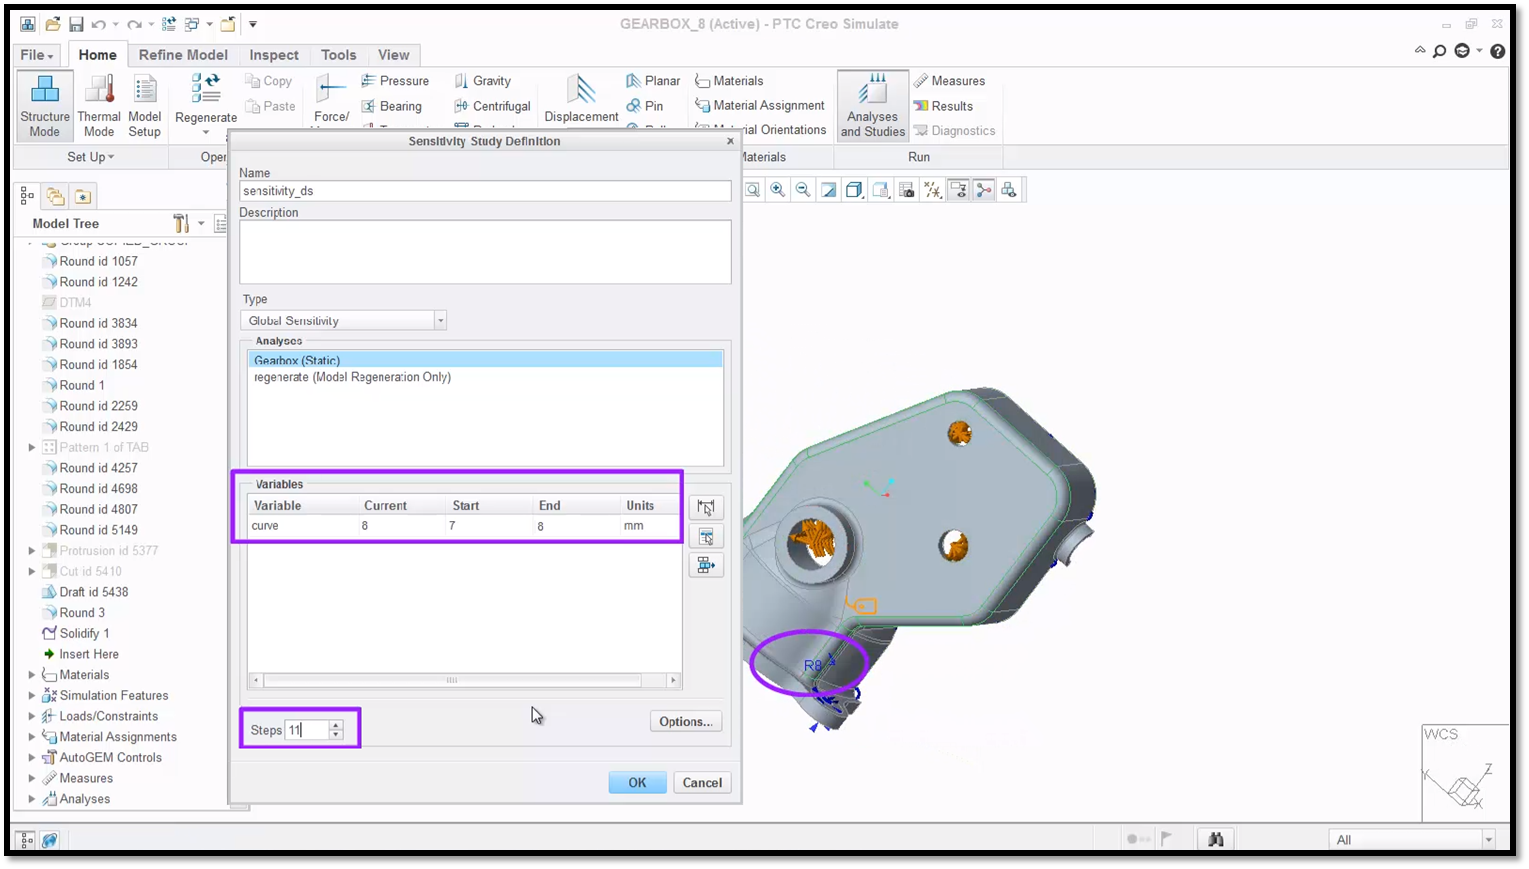
In this example, both Current and End are defined as 8.
You may want to set a parameter, such as load, for some design studies. In order to do this, return to the model and go to the parameter feature. In this model, one of the loads is set as a parameter. We will click Start Run (the green flag icon) to run the sensitivity design study, and Yes to run the interactive diagnostics. Once the analysis is complete, close the Diagnostic dialogue box.
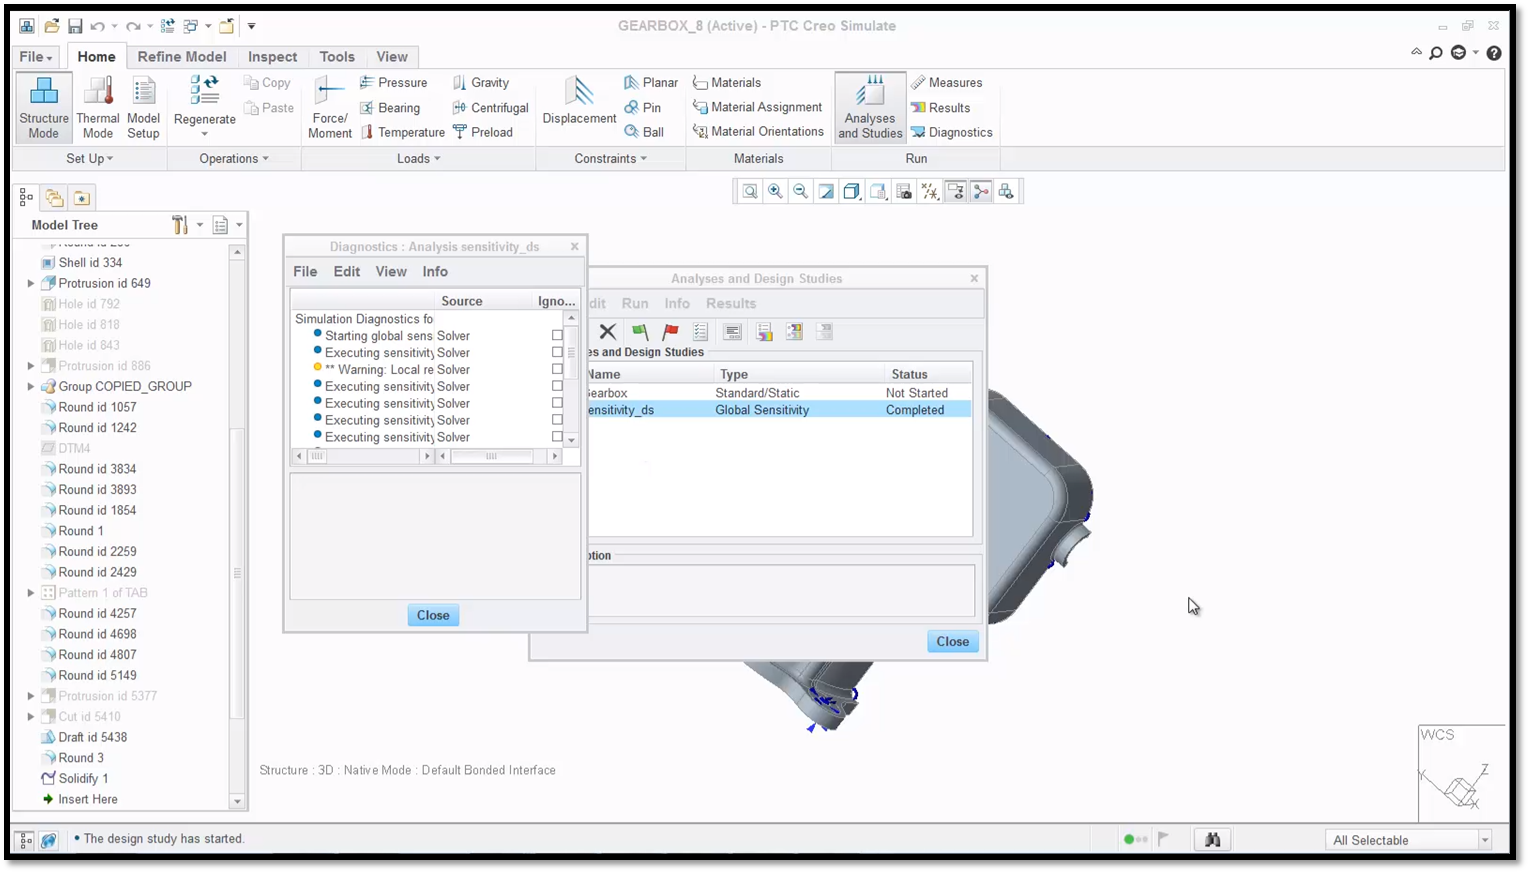
After completion, you can see the list of diagnostics from the study.
The next step is to review how the maximum principle stress changes with a change in the curve radius. Click the icon with two bullet points and a rainbow graph (Review Results) to open the Results Window Definition dialogue box. On the Quantity tab, in the Graph Ordinate (Vertical) Axis section click Measures to open the Measures dialogue box. Select max_stress_prin from the Predefined list.
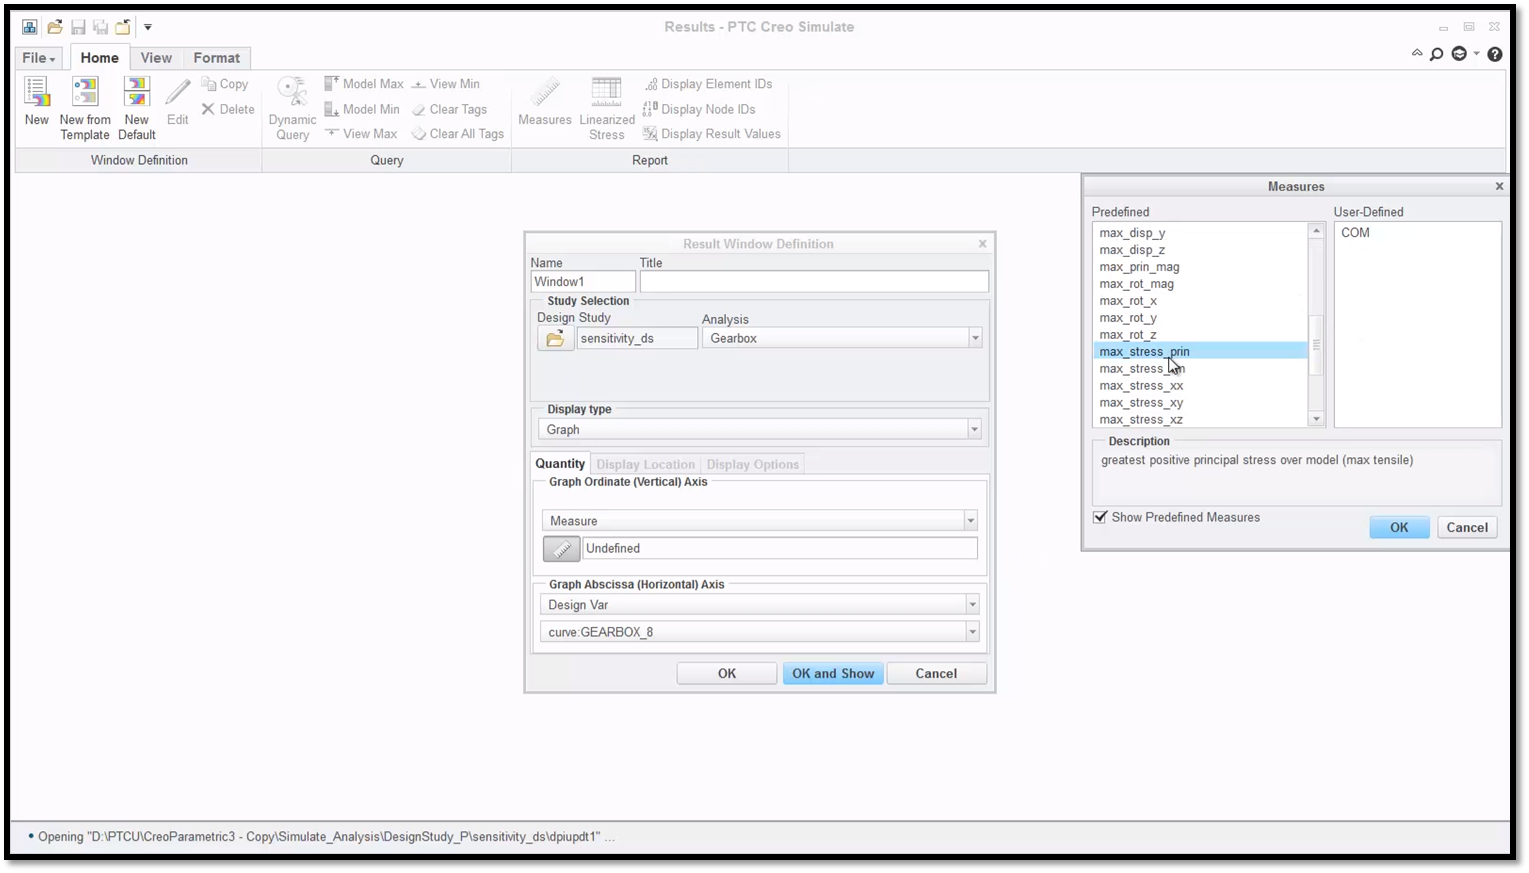
On the list, maximum principal stress is represented as max_stress_prin.
Click OK and Show to display the graph result. Note how the stress drops significantly when the curve radius is greater than approximately 7.1.
Note: It is good practice to run a Global Sensitivity Study on all critical dimension parameters in your model. The study results can be used when conducting an Optimization Study in PTC Creo Simulate to help determine the optimal range for each variable.
After reviewing the graph, use the File menu to close the result window and do not save the results. Close the Analyses and Design Studies dialogue box. Using the File menu, hover over Manage Session and select Erase Current to erase the model from memory.

The graph shows how the curve radius impacts the maximum principal stress in the gearbox.
To learn more about conducting a Global Sensitivity Design Study check out our video tutorial (“Performing a Design Study”).
Stay tuned to our “Did You Know” blog series as we cover all of the exciting, new enhancements in PTC Creo 3.0.
For more in-depth product feature explanations, visit our Tech Tips area.
Have some ideas about what PTC Creo product features you’d like to learn more about? Send me a message or leave a comment below and we’ll write up the best ideas from the community. Thanks for reading, looking forward to all of your feedback!
In case you missed it, see what’s new and check out our recent Did You Know posts covering PTC Creo 3.0 enhancements:
- Did You Know? PTC Creo 3.0 Enhancements: Chamfer Support in PTC Creo Flexible Modeling Extension
- Fast Facts! Quick Tips for Using PTC Creo - Mechanism Part 2
- Did You Know? Concept Design with Design Exploration Extension
This thread is inactive and closed by the PTC Community Management Team. If you would like to provide a reply and re-open this thread, please notify the moderator and reference the thread. You may also use "Start a topic" button to ask a new question. Please be sure to include what version of the PTC product you are using so another community member knowledgeable about your version may be able to assist.


