Community Tip - When posting, your subject should be specific and summarize your question. Here are some additional tips on asking a great question. X
- Community
- Creo+ and Creo Parametric
- 3D Part & Assembly Design
- Draft analysis
- Subscribe to RSS Feed
- Mark Topic as New
- Mark Topic as Read
- Float this Topic for Current User
- Bookmark
- Subscribe
- Mute
- Printer Friendly Page
Draft analysis
- Mark as New
- Bookmark
- Subscribe
- Mute
- Subscribe to RSS Feed
- Permalink
- Notify Moderator
Draft analysis
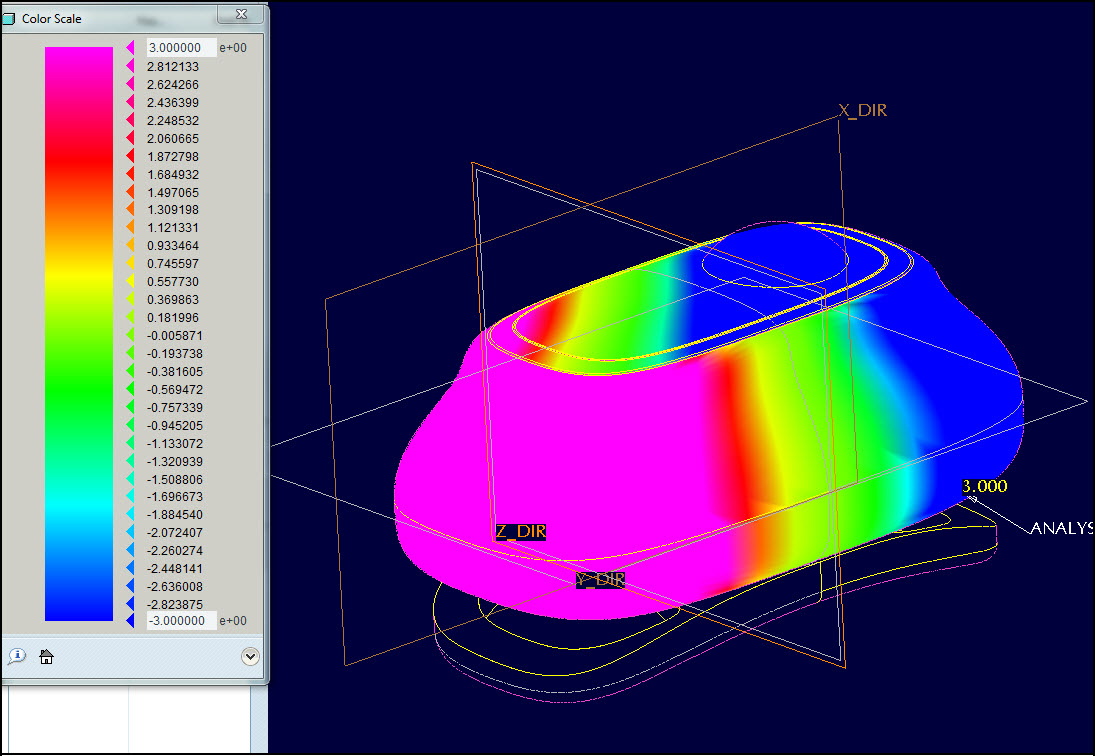
I am using Creo 2.0. Whenever I call up a saved draft check on my part, 2 things happen: firstly, the color scale window flashes quickly then disappears under the active window. I have to drag my active window to one side to bring it to the top. (And I have to bring it to the top because...) Secondly the draft display setting goes back to the default 5 colors, even though I've saved the scheme and I've saved the analysis. I don't want 5 colors in my draft analysis - it's not precise enough.
Does anyone know of a config.pro setting that keeps the color scale window to the top, or one that sets the number of colors to the amount I want? Even a config.sup or some setting in the install directory? I sometimes pull up a draft check dozens of times a day. I don't want to have to faff around like an amateur every time I call it up. This never happened in Wildfire or in earlier versions of Pro that I can remember.
This thread is inactive and closed by the PTC Community Management Team. If you would like to provide a reply and re-open this thread, please notify the moderator and reference the thread. You may also use "Start a topic" button to ask a new question. Please be sure to include what version of the PTC product you are using so another community member knowledgeable about your version may be able to assist.
- Mark as New
- Bookmark
- Subscribe
- Mute
- Subscribe to RSS Feed
- Permalink
- Notify Moderator
I am not having trouble with the window hiding in Creo 2.0 M040. This could be a graphic driver setting or even an driver option. This use to happened in Creo 1.0 but for the most part, it has resolved somehow... be it the graphics driver updates or Creo updates.
The saved scheme saves precious little data. It is almost useless unless you are using a specific color mix other than default that you need to reproduce for new analysis. There are several blanks that I am not sure what they are assigned to.
I find many of the analysis dialogs to be annoying at best. The draft dialog in particular is seriously misleading.
- Mark as New
- Bookmark
- Subscribe
- Mute
- Subscribe to RSS Feed
- Permalink
- Notify Moderator
I have M040 too, so it may be as you say, the graphics driver. Although... when I try out 5.0/Creo Elements the colors stay the same, but the number of color increments goes crazy. Then when I double-click on it when the draft is not in display, then it goes back to 5 colors. I love it when computers do random crap that seems to have no logic. 
- Mark as New
- Bookmark
- Subscribe
- Mute
- Subscribe to RSS Feed
- Permalink
- Notify Moderator
My NVidia driver pack had a "focus" application that I think was the problem. I removed the trash-ware and I think that is what solved my peek-a-boo windows.
Funny... when I 1st started playing with the Draft Analysis dialog this morning, while I was investigating your post, things were dog-slow and data was really off. Now that I've been playing with it for a while, it is interactive and the data between the scale and the part is correct. Weird!
What are you double clicking? I don't seem to get any response from that.
- Mark as New
- Bookmark
- Subscribe
- Mute
- Subscribe to RSS Feed
- Permalink
- Notify Moderator
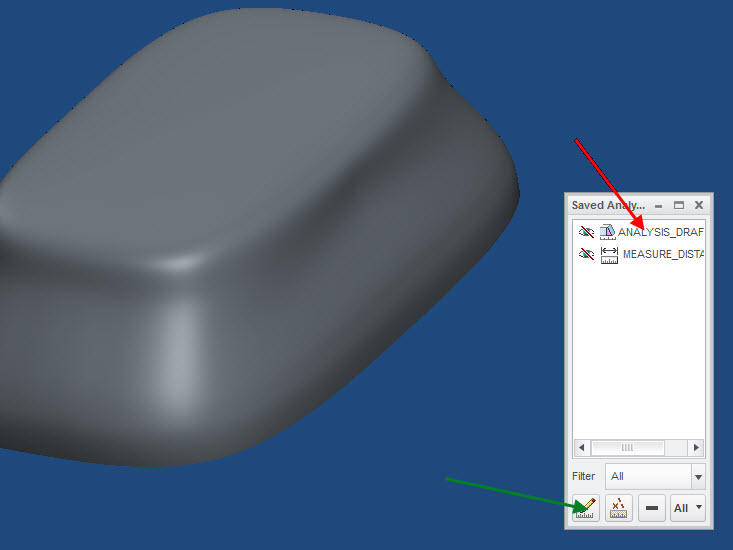
I double click at the red arrow, on the name of the analysis. It's the same as clicking at the green arrow - editing the definition. I did it accidentally at first.

- Mark as New
- Bookmark
- Subscribe
- Mute
- Subscribe to RSS Feed
- Permalink
- Notify Moderator
Aha! never used that dialog before. Thanks for pointing that out. Looks like you have to select the scheme separately and this restores the settings number. Quite annoying, I agree. Maybe post an Idea for an overhaul of the way that saved analysis work. Actually, I would consider this particular one a bug. It really should come back exactly as you saved it.


