Community Tip - Visit the PTCooler (the community lounge) to get to know your fellow community members and check out some of Dale's Friday Humor posts! X
- Subscribe to RSS Feed
- Mark as New
- Mark as Read
- Bookmark
- Subscribe
- Printer Friendly Page
- Notify Moderator
Feature Engineering
A Feature - a piece of information that is potentially useful for prediction. Any attribute could be a feature, as long as it is useful to the model.
Feature engineering – Feature engineering is the process of transforming raw data into features that better represent the underlying problem to the predictive models, resulting in improved model accuracy on unseen data. It’s a vaguely agreed space of tasks related to designing feature sets for Machine Learning applications.
Components: First, understanding the properties of the task you’re trying to solve and how they might interact with the strengths and limitations of the model you are going to use.
Second, experimental work were you test your expectations and find out what actually works and what doesn’t.
Feature engineering as a technique, has three sub categories of techniques: Feature selection, Dimension reduction and Feature generation.
Feature Selection:
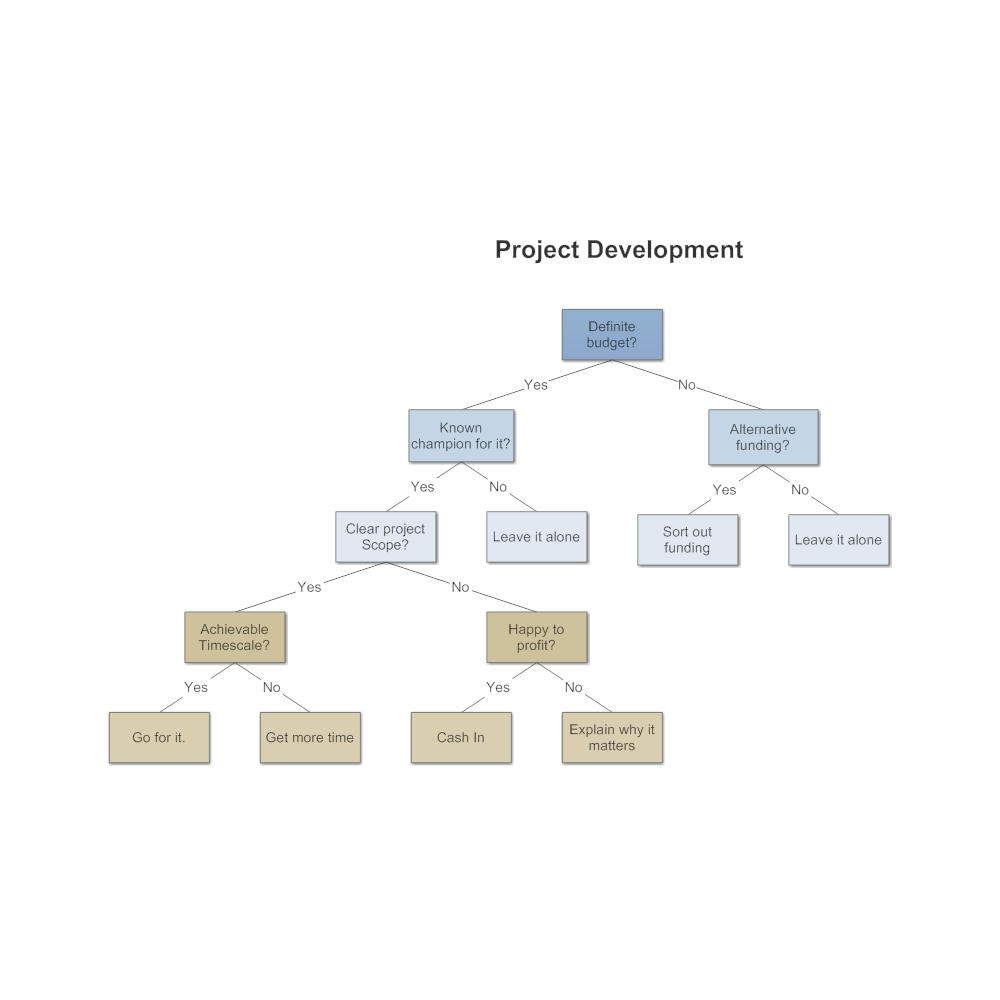
Sometimes called feature ranking or feature importance, this is the process of ranking the attributes by their value to predictive ability of a model. Algorithms such as decision trees automatically rank the attributes in the data set. The top few nodes in a decision tree are considered the most important features from a predictive stand point. As a part of a process, feature selection using entropy based methods like decision trees can be employed to filter out less valuable attributes before feeding the reduced dataset to another modeling algorithm. Regression type models usually employ methods such as forward selection or backward elimination to select the final set of attributes for a model.
For example: Project Development decision-tree:

Dimension Reduction:
This is sometimes called feature extraction. The most classic example of dimension reduction is principle component analysis or PCA. PCA allows us to combine existing attributes into a new data frame consisting of a much reduced number of attributes by utilizing the variance in the data. The attributes which "explain" the highest amount of variance in the data form the first few principal components and we can ignore the rest of the attributes if data dimensionality is a problem from a computational standpoint.
Feature Generation or Feature Construction:
Quite simply, this is the process of manually constructing new attributes from raw data. It involves intelligently combining or splitting existing raw attributes into new one which have a higher predictive power. For example a date stamp may be used to generate 2 new attributes such as AM and PM which may be useful in discriminating whether day or night has a higher propensity to influence the response variable. Feature construction is essentially a data transformation process.
Tips for Better Feature Engineering
Tip 1: Think about inputs you can create by rolling up existing data fields to a higher/broader level or category. As an example, a person’s title can be categorized into strategic or tactical. Those with titles of “VP” and above can be coded as strategic. Those with titles “Director” and below become tactical. Strategic contacts are those that make high-level budgeting and strategic decisions for a company. Tactical are those in the trenches doing day-to-day work. Other roll-up examples include:
- Collating several industries into a higher-level industry: Collate oil and gas companies with utility companies, for instance, and call it the energy industry, or fold high tech and telecommunications industries into a single area called “technology.”
- Defining “large” companies as those that make $1 billion or more and “small” companies as those that make less than $1 billion.
Tip 2: Think about ways to drill down into more detail in a single field. As an example, a contact within a company may respond to marketing campaigns, and you may have information about his or her number of responses. Drilling down, we can ask how many of these responses occurred in the past two weeks, one to three months, or more than six months in the past. This creates three additional binary (yes=1/no=0) data fields for a model. Other drill-down examples include:
- Cadence: Number of days between consecutive marketing responses by a contact: 1–7, 8–14, 15–21, 21+
- Multiple responses on same day flag (multiple responses = 1, otherwise =0)
Tip 3: Split data into separate categories also called bins. For example, annual revenue for companies in your database may range from $50 million (M) to over $1 billion (B). Split the revenue into sequential bins: $50–$200M, $201–$500M, $501M–$1B, and $1B+. Whenever a company falls with the revenue bin it receives a one; otherwise the value is zero. There are now four new data fields created from the annual revenue field. Other examples are:
- Number of marketing responses by contact: 1–5, 6–10, 10+
- Number of employees in company: 1–100, 101–500, 502–1,000, 1,001–5,000, 5,000+
Tip 4: Think about ways to combine existing data fields into new ones. As an example, you may want to create a flag (0/1) that identifies whether someone is a VP or higher and has more than 10 years of experience. Other examples of combining fields include:
- Title of director or below and in a company with less than 500 employees
- Public company and located in the Midwestern United States
You can even multiply, divide, add, or subtract one data field by another to create a new input.
Tip 5: Don’t reinvent the wheel – use variables that others have already fashioned.
Tip 6: Think about the problem at hand and be creative. Don’t worry about creating too many variables at first, just let the brainstorming flow.

