
Turn on suggestions
Auto-suggest helps you quickly narrow down your search results by suggesting possible matches as you type.
Showing results for
Please log in to access translation
Turn on suggestions
Auto-suggest helps you quickly narrow down your search results by suggesting possible matches as you type.
Showing results for
- Community
- IoT & Connectivity
- IoT & Connectivity Tips
- Widget Extensions User D3
Please log in to access translation
Options
- Subscribe to RSS Feed
- Mark as New
- Mark as Read
- Bookmark
- Subscribe
- Printer Friendly Page
- Notify Moderator
Widget Extensions User D3
No ratings
Please log in to access translation
Initial Objective statements
This post is about getting D3 connected as an extension to Thingworx.
There are a number of existing extensions using D3 but I wanted to explore a simple use case to make it easier to get into and bring out 2 additional points
- Using an infotable as data input
- Resize
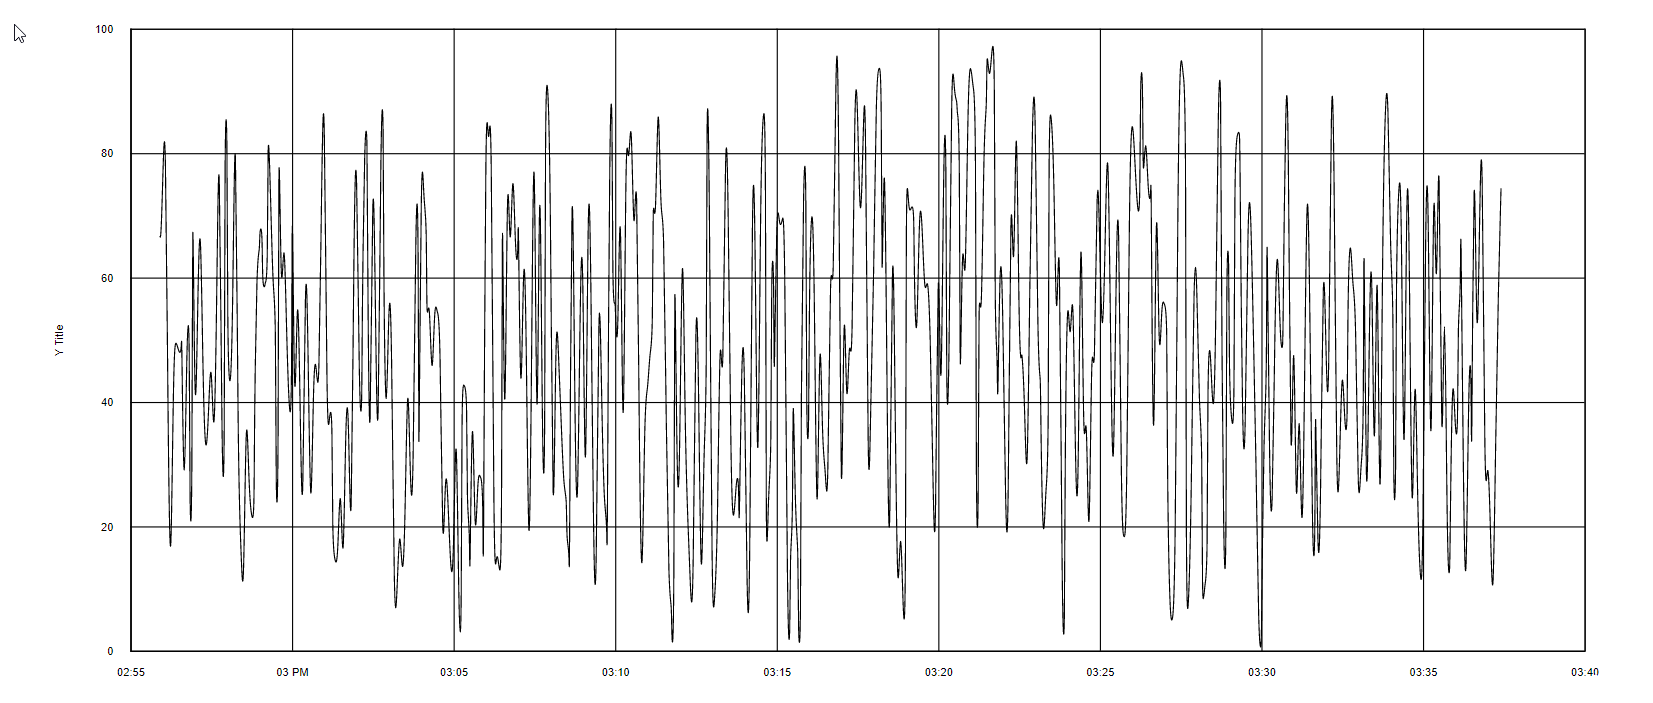
The output looks like the image below
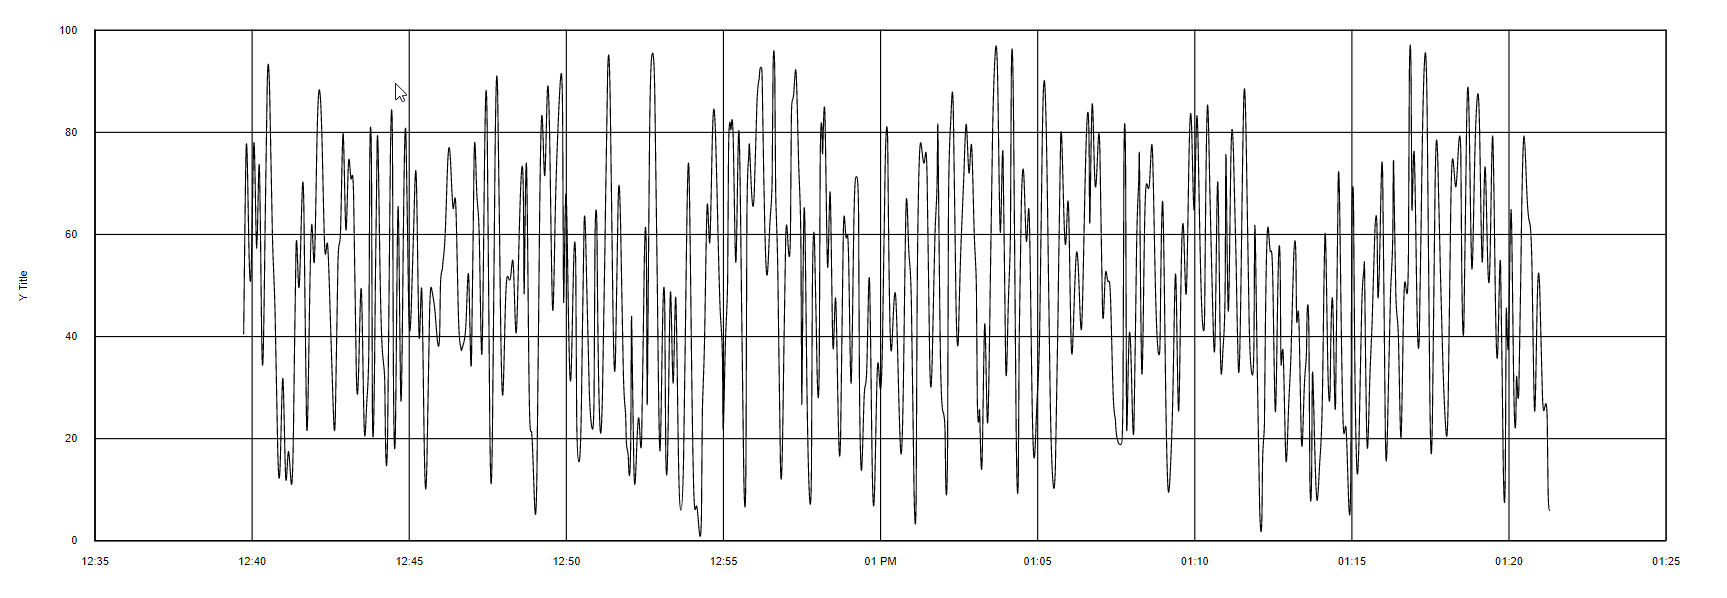
and the data was generated by a Timer based random value generator that set the values on a Thing every minute.
The data into the Widget is from a core service QueryHistory (a wrapped service that uses QueryProperyHistory)
In this example I will use temp as the variable in focus
If you have never created an extension take a look at Widget Extensions Introduction which provides a start to understanding the steps defined below, which are the core points to keep it relatively short.
The extension will be called d3timeseries and will use the standard design pattern
Create a folder called d3timeseries and create a subfolder ui and a add a metadata.xml file to the d3timeseries
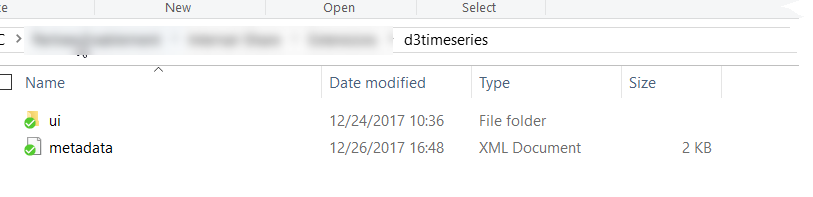
From there create the files and folder structure
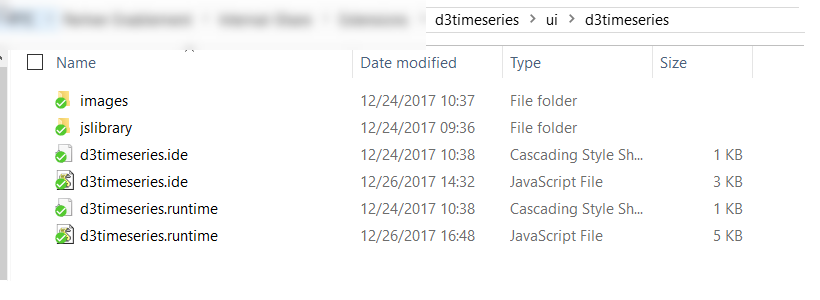
define the metadata.xml using CDN url for
D3 url url="https://d3js.org/d3.v4.js"
legend url = "https://cdnjs.cloudflare.com/ajax/libs/d3-legend/2.25.3/d3-legend.js"
Also check out https://d3js.org/ which provides documentation and examples for D3
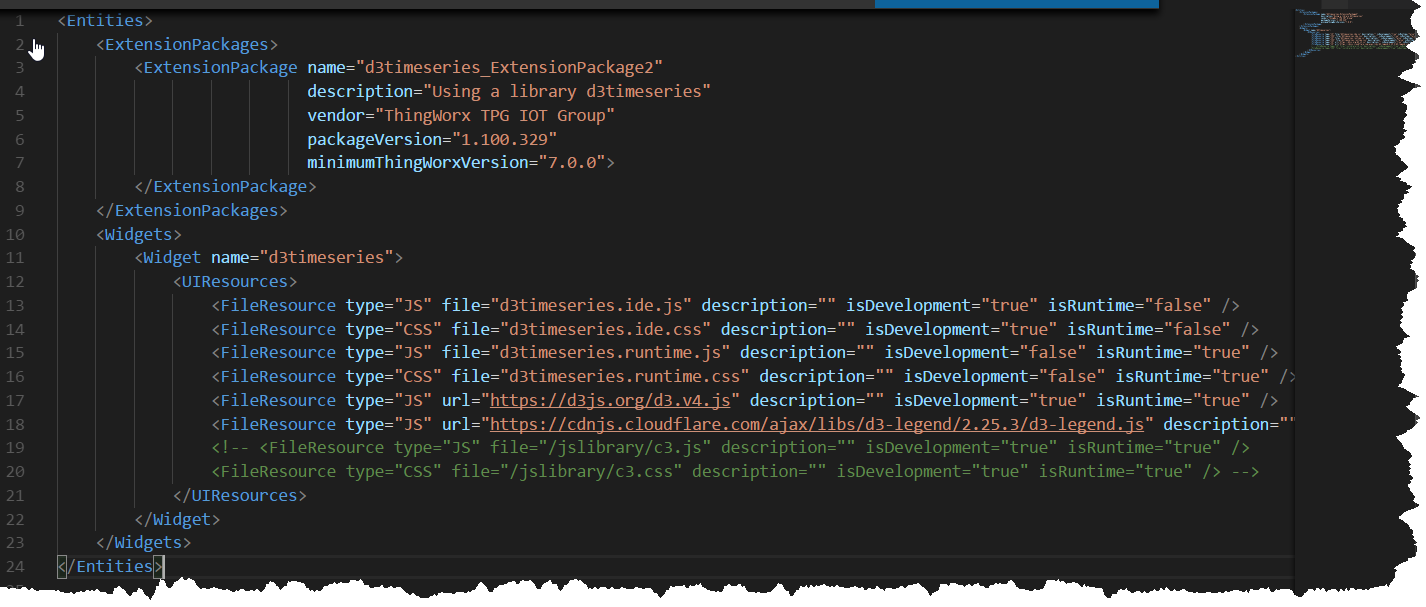
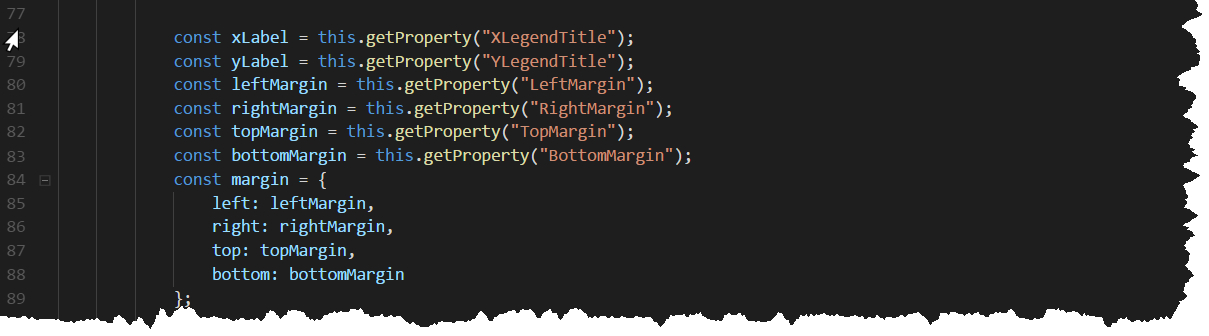
For the initial set of Properties that control the D3 will use
DataAsINFOTABLE (Data coming into d3)
Title
XLegendTitle
YLegendTitle
TopMargin
BottomMargin
LeftMargin
RightMargin
Note: we are not using Width and Height as in previous articles but setting 'supportsAutoResize': true,
Below shows the general structure will use for the d3timeseries.ide.js properties

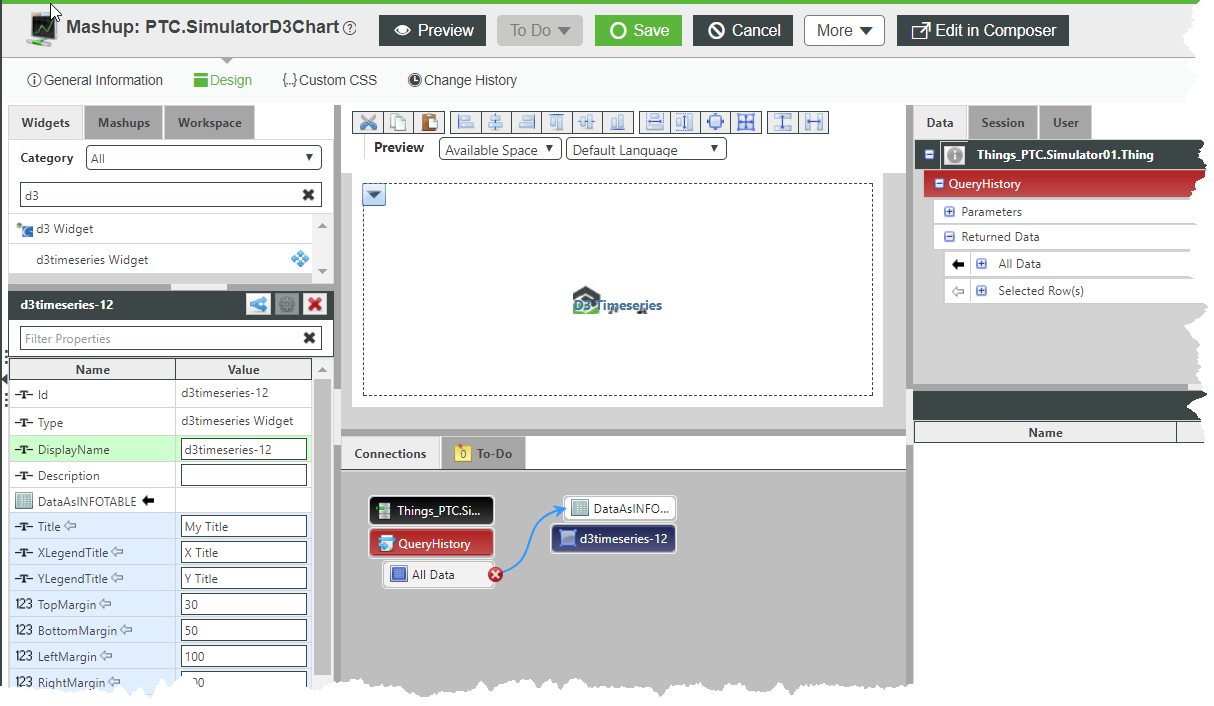
After deploying the extension (take look at Widget Extensions Introduction to understand the how) we can see its now possible to provide Data input and some layout controls as parameters

From there we can work in the d3timeseries.runtime.js file to define how to consume and pass data to D3.
There a 4 basic function that need to be defined
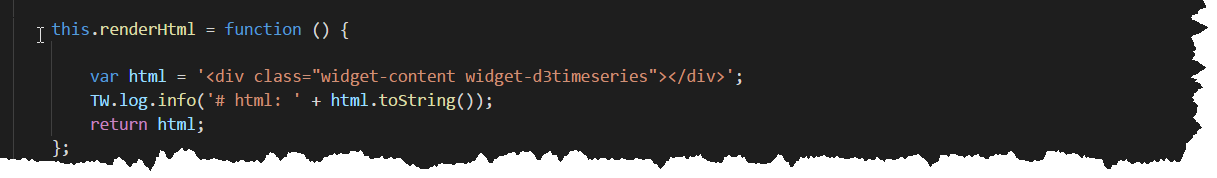
- this.renderHtml
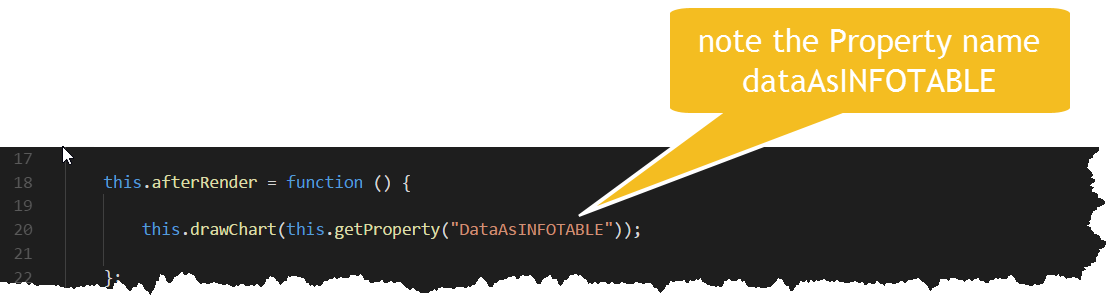
- this.afterRender
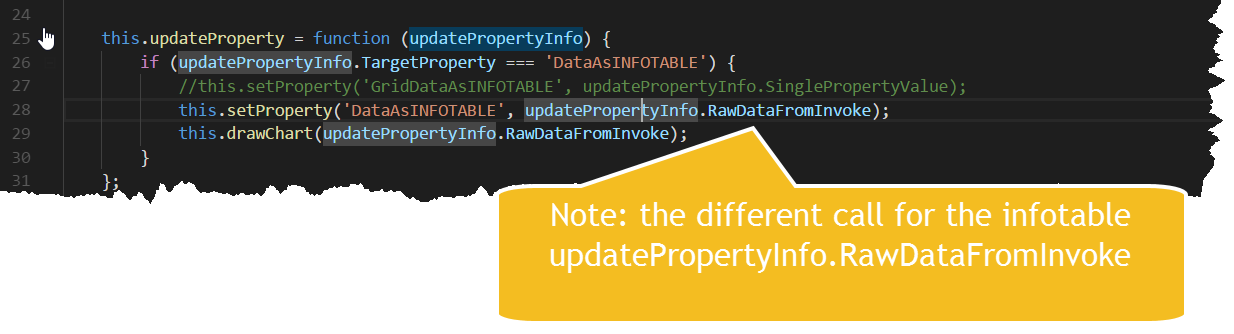
- this.updateProperty
- this.resize
renderHtml
afterRender
updateProperty
resize

The actual D3 worker is drawChart which I will break down the highlights
I use an init function to setup where the SVG element will be placed

The init is called inside drawChart

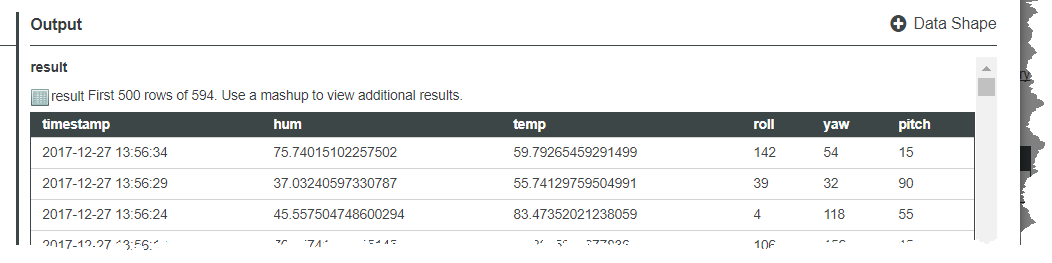
Next inside drawChart the rowData incoming parameter is checked for any content we can consume the expected rows object

Next the x and y ranges need to be defined and notice that I have hardcoded for d.timestamp and d.temp these 2 are returned in the infotable rows

The last variable inputs are the layout properties
Now we have the general inputs defined the last piece is to use D3 to draw the visualization (and note we have chosen a simple visualization timeseries chart)
Define a svg variable and use D3 to select the div element defined in the init function. Also remove any existing elements this helps in the resize call.

Get the current width and height as before

Now do some D3 magic (You will have to read in more detail the D3 documentation to get the complete understanding)
Below sets up the x and y axis and labels

Next define x and y scale so the visualization fits in the area available and actually add the axis's and ticks, plus the definition for the actual line const line = d3.line()
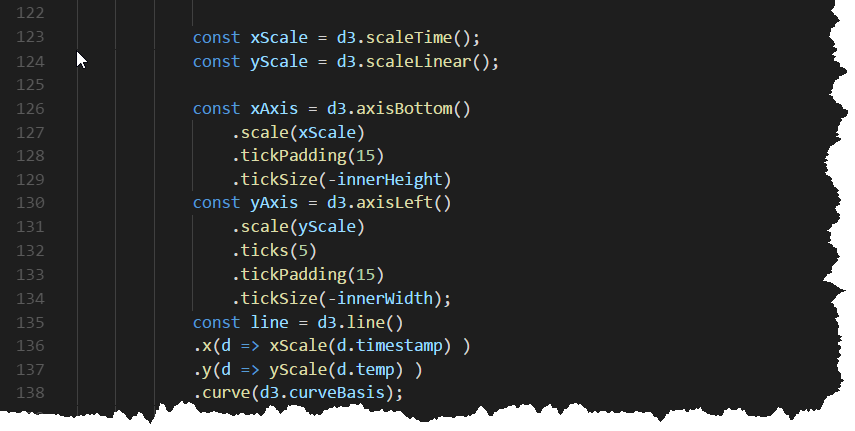
Now we are ready for the row data which gets defined as data and passed to the xScale and yScale using in the const line = d3.line()

After zipping up and deploying and using in a mashup you should get a D3 timeseries chart.
Code for the QueryHistory
logger.debug("Calling "+ me.name + ":QueryHistory");
// result: INFOTABLE
var result = me.QueryPropertyHistory({
maxItems: undefined /* NUMBER */,
startDate: undefined /* DATETIME */,
endDate: undefined /* DATETIME */,
oldestFirst: undefined /* BOOLEAN */,
query: undefined /* QUERY */
});
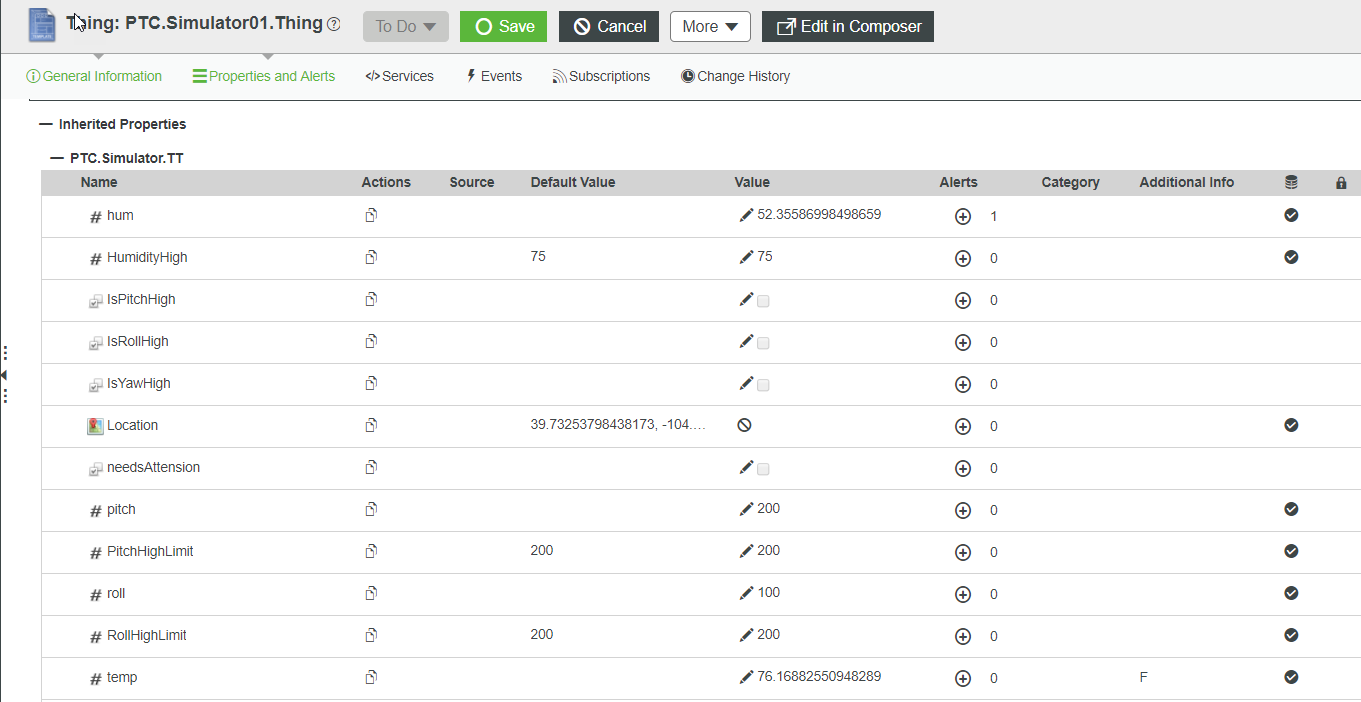
Thing properties example
Random generator code
me.hum = Math.random() * 100;
me.temp = Math.random() * 100;
message = message + "Hum=" + me.hum+ " ";
message = message + "Temp=" +me.temp+ " ";
logger.debug(me.name + " RandomGenerator values= " + message );
result = message;
Previous Posts
Comments
Sep 08, 2019
08:36 PM
- Mark as Read
- Mark as New
- Bookmark
- Permalink
- Notify Moderator
Please log in to access translation
Sep 08, 2019
08:36 PM
Hi @sgreywilson,
Thank you for your post for helping me to get started on my widget extension using d3.js. However, rather than a timeseries chart, I now have an XY chart which looks as follows (done using the existing XY chart widget in Thingworx). I want the x-axis to be on the top of the chart so that the intersection of the x-axis with the y-axis is in the top left corner instead of the bottom left corner. The x-axis values should increase from left to right and the y-axis values should increase from top to bottom. Therefore, I have combined the code of an XY chart widget with your code.
Current results (using existing XY chart widget and d3.js respectively):


Expected result:

I have studied and followed your example but I am stuck on getting the grid lines for the x-axis and displaying the binded data in my infotable. My infotable is as shown below. I am using the XAxis value (1,2,3) for my XAxisField and ASensor value (5,10,15) for my DataField1 in the composer.

I have attached the zip file containing the code for the existing XY chart widget for reference as well. Any help will be greatly appreciated!
Jul 01, 2020
12:56 AM
- Mark as Read
- Mark as New
- Bookmark
- Permalink
- Notify Moderator
Please log in to access translation
Jul 01, 2020
12:56 AM
I am currently using Thingworx 8.5.3. I am trying to integrate D3 charts using custom widget extension.
I have an fair idea how I need to set up environment using eclipse. Now I need an help how to proceed further with code devlopment.
Jul 16, 2021
04:24 AM
- Mark as Read
- Mark as New
- Bookmark
- Permalink
- Notify Moderator
Please log in to access translation
Jul 16, 2021
04:24 AM
When I try to import this extension to ThingWorx 9.1 the mashup builder fails to load. Is there any know issues to import this extension to the newer ThingWorx platform?
