- Community
- IoT & Connectivity
- IoT & Connectivity Tips
- Analyzing ThingWorx Utilization Statistics in Exce...
- Subscribe to RSS Feed
- Mark as New
- Mark as Read
- Bookmark
- Subscribe
- Printer Friendly Page
- Notify Moderator
Analyzing ThingWorx Utilization Statistics in Excel
Back in 2018 an interesting capability was added to ThingWorx Foundation allowing you to enable statistical calculation of service and subscription execution.
We typically advise customers to approach this with caution for production systems as the additional overhead can be more than you want to add to the work the platform needs to handle. This said, these statistics is used consciously can be extremely helpful during development, testing, and troubleshooting to help ascertain which entities are executing what services and where potential system bottlenecks or areas deserving performance optimization may lie.
Although I've used the Utilization Subsystem services for statistics for some time now, I've always found that the Composer table view is not sufficient for a deeper multi-dimensional analysis. Today I took a first step in remedying this by getting these metrics into Excel and I wanted to share it with the community as it can be quite helpful in giving developers and architects another view into their ThingWorx applications and to take and compare benchmarks to ensure that the operational and scaling is happening as was expected when the application was put into production.
Utilization Subsystem Statistics
You can enable and configure statistics calculation from the Subsystem Configuration tab. The help documentation does a good job of explaining this so I won't mention it here. Base guidance is not to use Persisted statistics, nor percentile calculation as both have significant performance impacts. Aggregate statistics are less resource intensive as there are less counters so this would be more appropriate for a production environment. Specific entity statistics require greater resources and this will scale up as well with the number of provisioned entities that you have (ie: 1,000 machines versus 10,000 machines) whereas aggregate statistics will remain more constant as you scale up your deployment and its load.
Utilization Subsystem Services
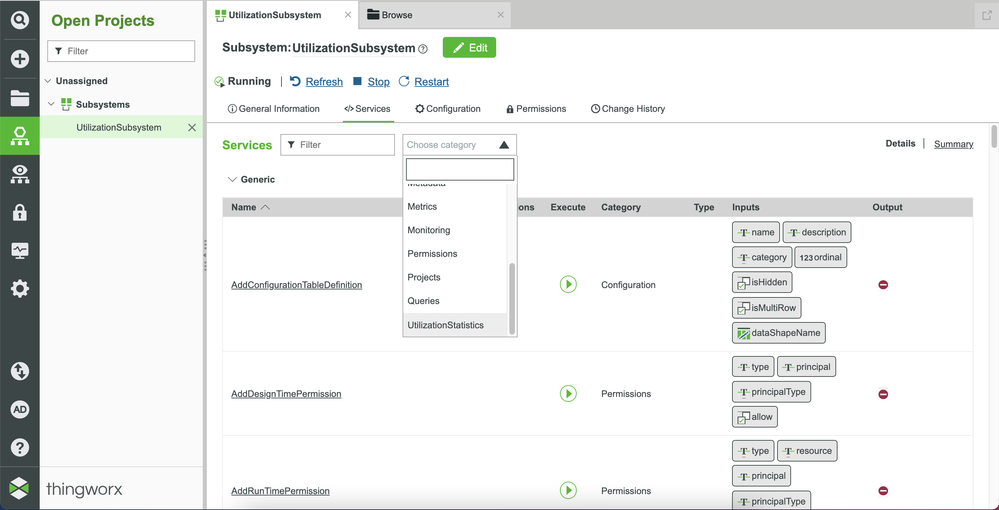
In the subsystem Services tab, you can select "UtilizationSubsystem" from the filter drop down and you will see all of the relevant services to retrieve and reset the statistics.
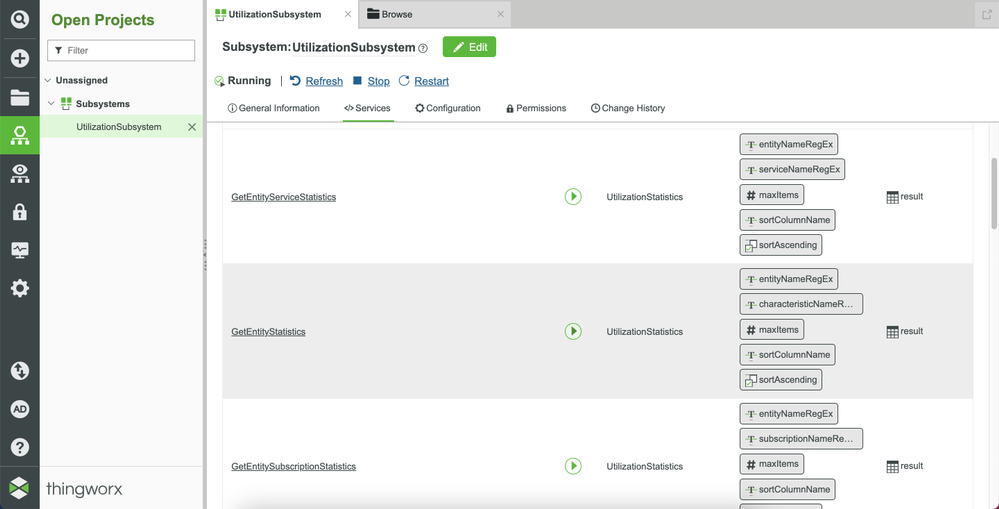
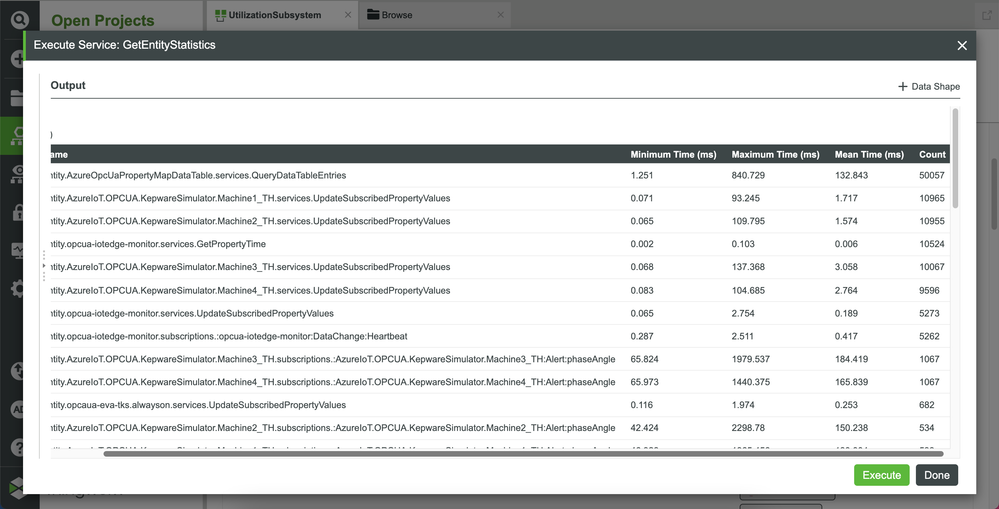
Here I'm using the GetEntityStatistics service to get entity statistics for Services and Subscriptions.
Giving us something like this.
Using Postman to Save the Results to File
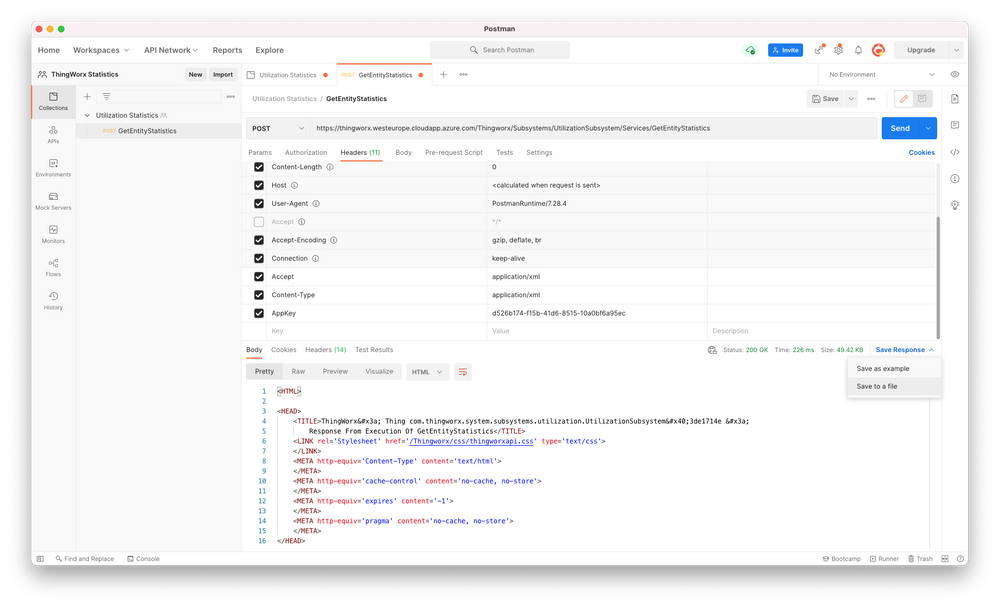
I have used Postman to do the same REST API call and to format the results as HTML and to save these results to file so that they can be imported into Excel.
You need to call '/Thingworx/Subsystems/UtilizationSubsystem/Services/GetEntityStatistics' as a POST request with the Content-Type and Accept headers set to 'application/xml'. Of course you also need to add an appropriately permissioned and secured AppKey to the headers in order to authenticate and get service execution authorization.
You'll note the Export Results > Save to a file menu over on the right to get your results saved.
Importing the HTML Results into Excel
As simple as I would like to hope that getting a standard web formatted file into Excel should be, it didn't turn out to be as easy as I would have hoped and so I have to switch over to Windows to take advantage of Power Query.
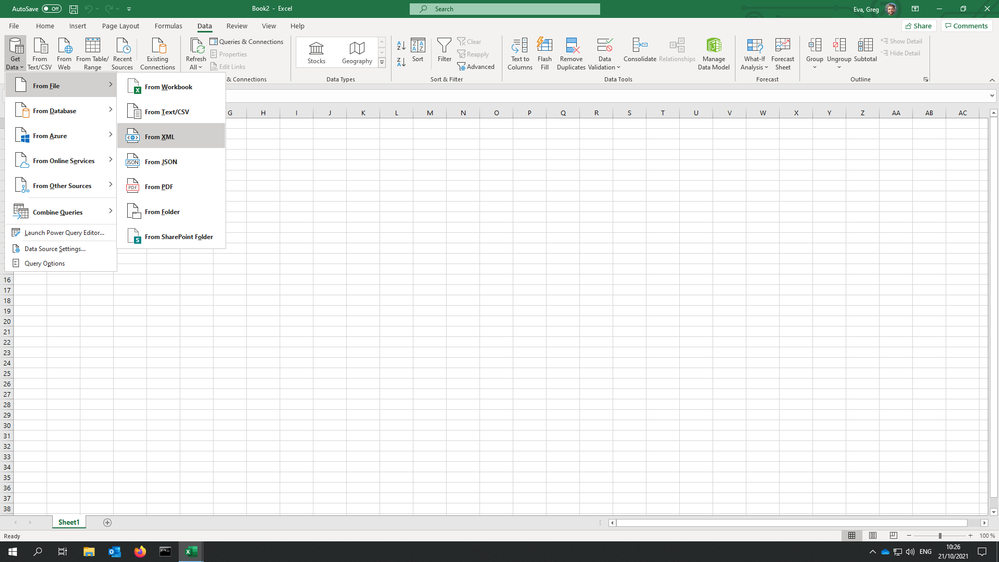
From the Data ribbon, select Get Data > From File > From XML. Then find and select the HTML file saved in the previous step.
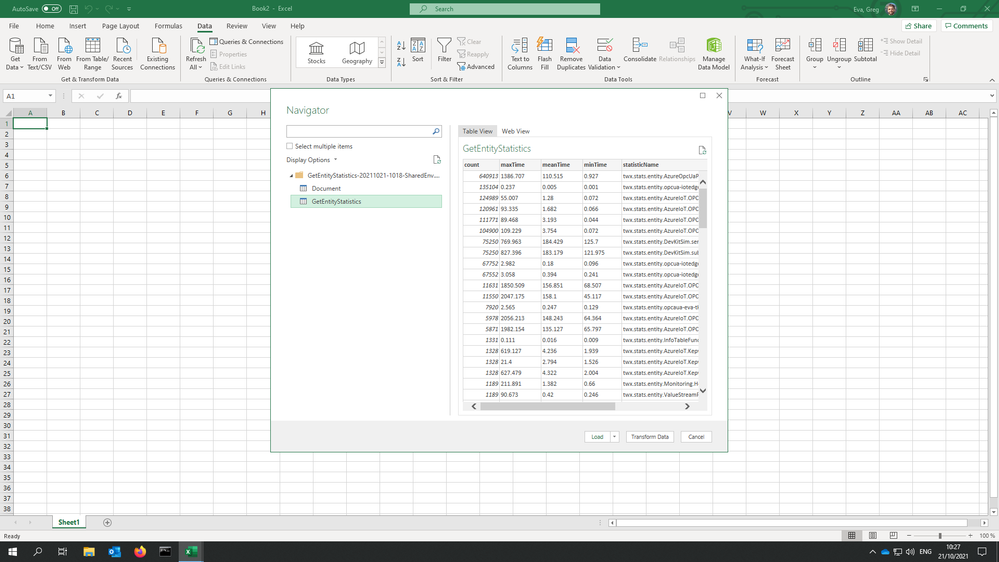
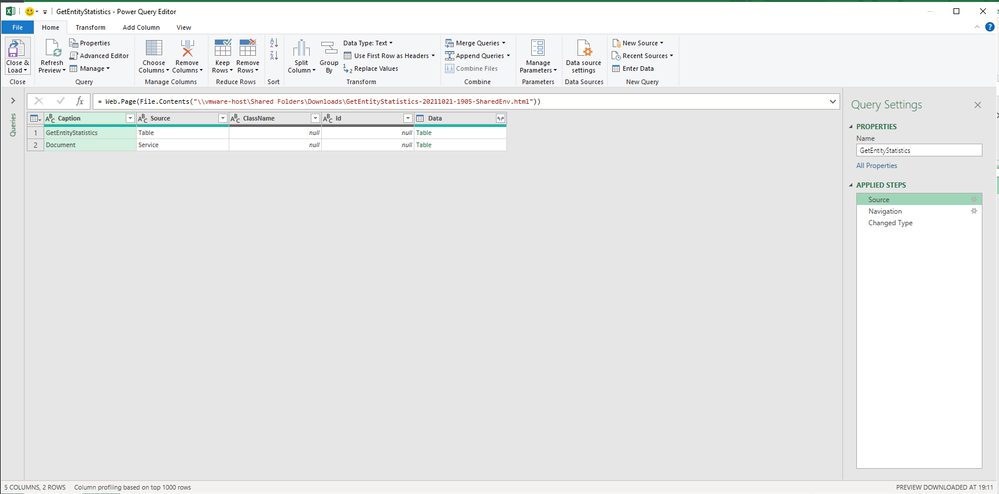
Once it has loaded the file and done some preparation, you'll need to select the GetEntityStatistics table in the results on the left. This should display all of the statistics in a preview table on the right.
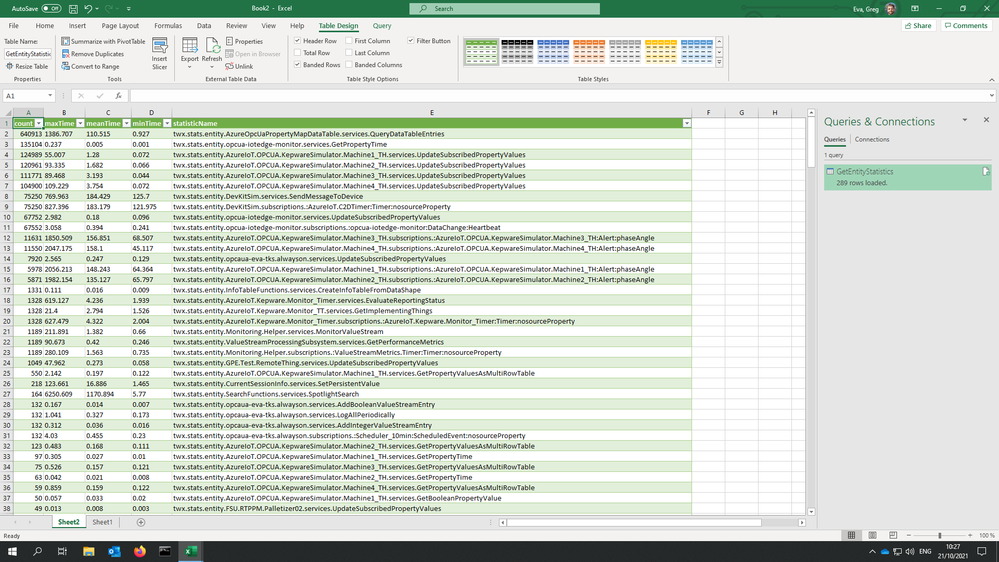
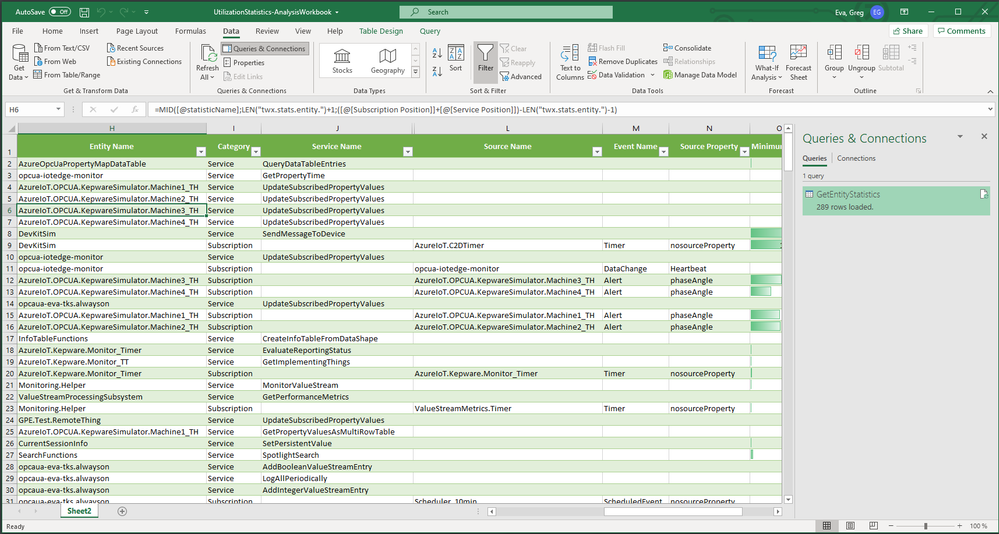
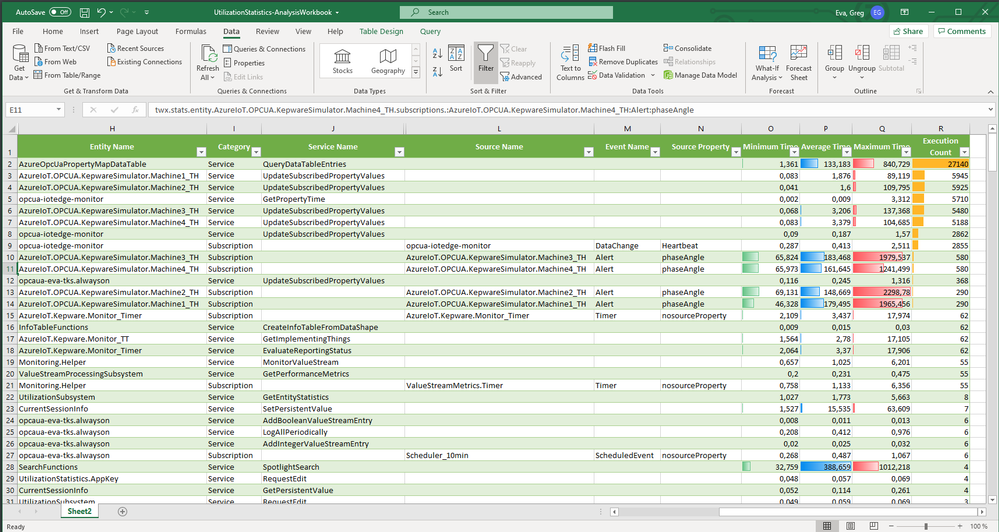
Once the query completed, you should have a table showing your statistical data ready for... well... slicing and dicing.
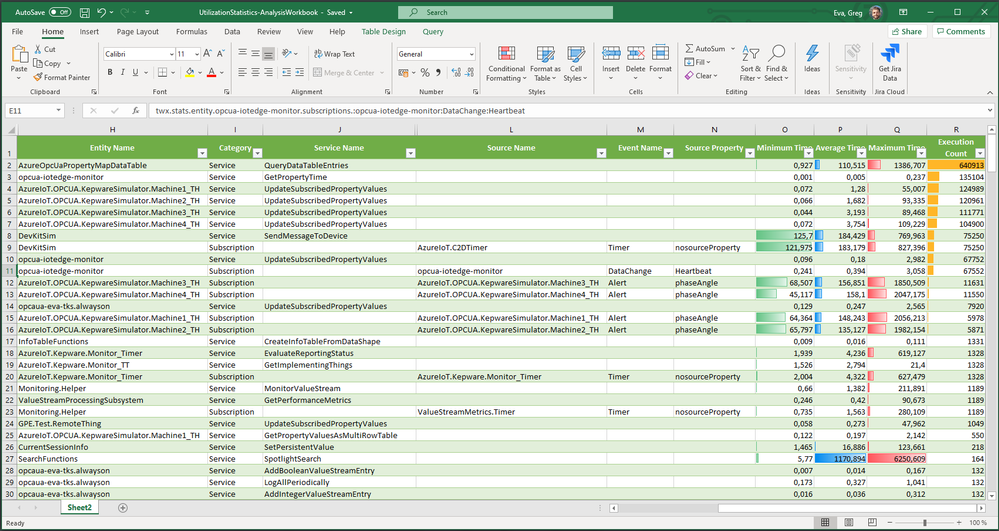
The good news is that I did the hard part for you, so you can just download the attached spreadsheet and update the dataset with your fresh data to have everything parsed out into separate columns for you.
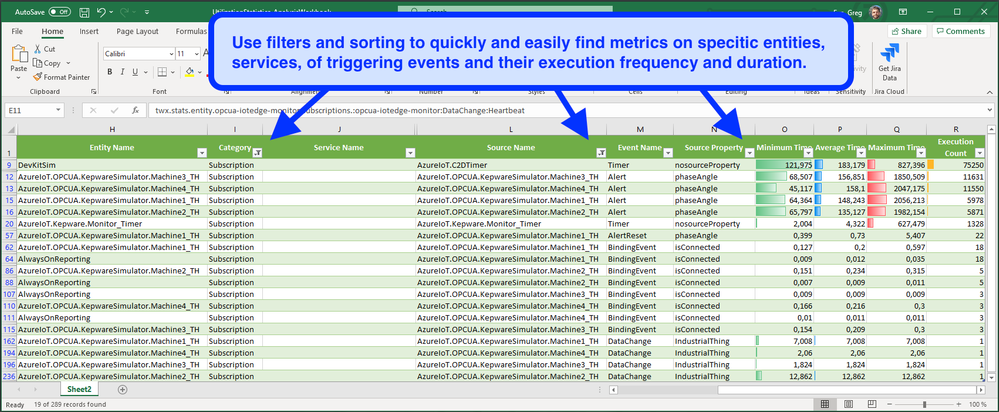
Now you can use the column filters to search for entity or service patterns or to select specific entities or attributes that you want to analyze. You'll need to later clear the column filters to get your whole dataset back.
Updating the Spreadsheet with Fresh Data
In order to make this data and its analysis more relevant, I went back and reset all of the statistics and took a new sample which was exactly one hour long. This way I would get correct recent min/max execution time values as well as having a better understanding of just how many executions / triggers are happening in a one hour period for my benchmark.
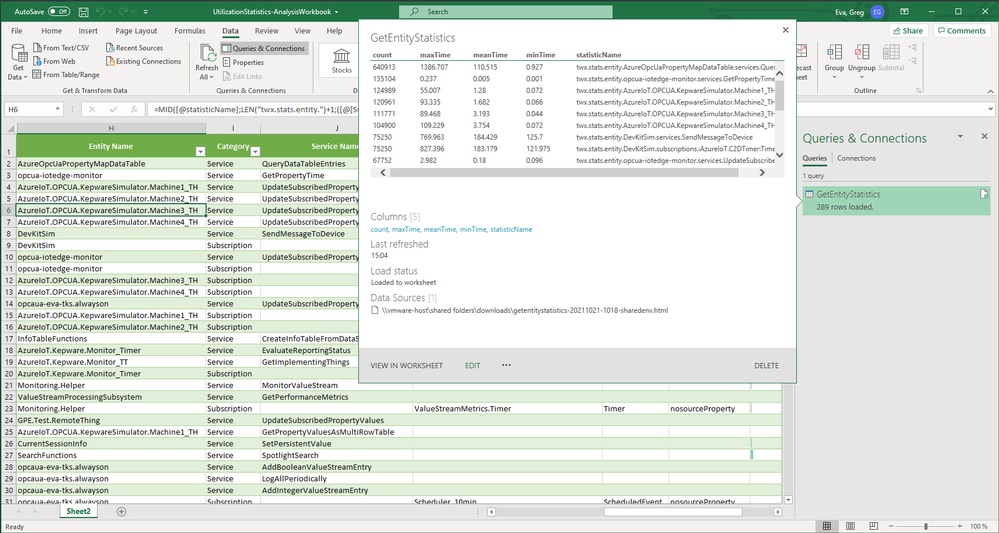
Once I got the new HTML file save, I went into Excel's Data ribbon, selected a cell in the data table area, and clicked "Queries & Connections" which brought up the pane on the right which shows my original query.
Hovering over this query, I'm prompted with some stuff and I chose "Edit".
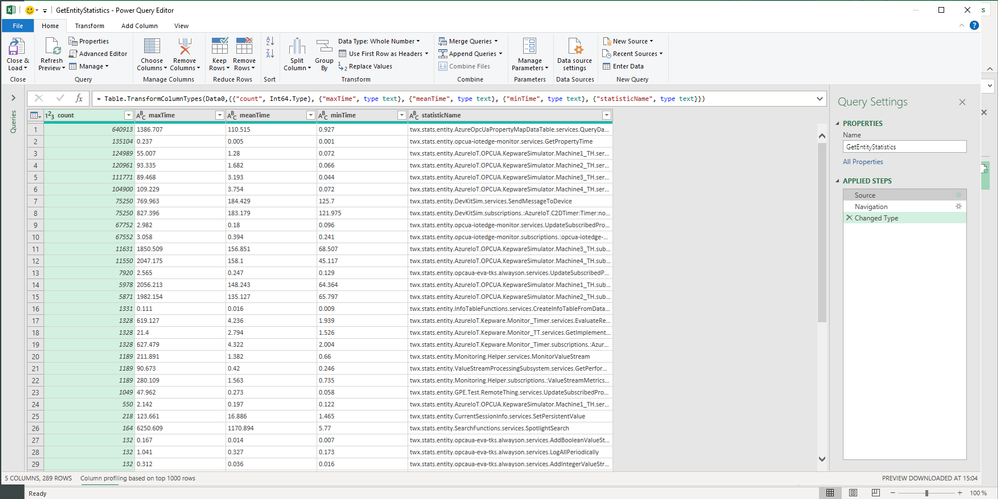
Then I clicked on the tiny little gear to the right of "Source" over on the pane on the right side.
Finally I was able to select the new file and Power Query opened it up for me.
I just needed to click "Close & Load" to save and refresh the query providing data to the table.
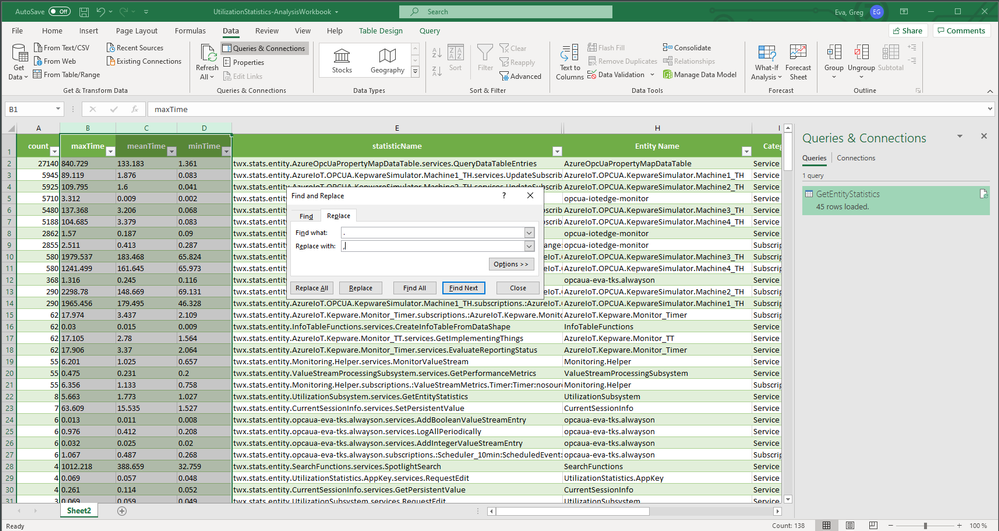
The only thing at this point is that I didn't have my nice little sparklines as my regional decimal character is not a period - so I selected the time columns and did a "Replace All" from '.' to ',' to turn them into numbers instead of text.
Et Voila!
There you have it - ready to sort, filter, search and review to help you better understand which parts of your application may be overly resource hungry, or even to spot faulty equipment that may be communicating and triggering workflows far more often than it should.
Specific vs General
Depending on the type of analysis that you're doing you might find that the aggregate statistics are a better option. As they'll be far, far less that the entity specific statistics they'll do a better job of giving you a holistic view of the types of things that are happening with your ThingWorx applications execution.
The entity specific data set that I'm showing here would be a better choice for troubleshooting and diagnostics to try to understand why certain customers/assets/machines are behaving strangely as we can specifically drill into these stats. Keep in mind however that you should then compare these findings with the general baseline to see how this particular asset is behaving compared to the whole fleet.
As a size guideline - I did an entity specific version of this file for a customer with 1,000 machines and the Excel spreadsheet was 7Mb compared to the 30kb of the one attached here and just opening it and saving it was tough for Excel (likely due to all of my nested formulas). Just keep this in mind as you use this feature as there is memory overhead meaning also garbage collection and associated CPU usage for such.

