Turn on suggestions
Auto-suggest helps you quickly narrow down your search results by suggesting possible matches as you type.
Showing results for
Please log in to access translation
Turn on suggestions
Auto-suggest helps you quickly narrow down your search results by suggesting possible matches as you type.
Showing results for
- Community
- IoT & Connectivity
- IoT & Connectivity Tips
- Concepts of Anomaly Detection used in ThingWatcher
Please log in to access translation
Options
- Subscribe to RSS Feed
- Mark as New
- Mark as Read
- Bookmark
- Subscribe
- Printer Friendly Page
- Notify Moderator
Concepts of Anomaly Detection used in ThingWatcher
No ratings
Please log in to access translation
Concepts of Anomaly Detection used in ThingWatcher
ThingWatcher is based on anomaly detection with the normal distribution. What does that mean?
Actually, normally distributed metrics follow a set of probabilistic rules. Upcoming values who follow those rules are recognized as being “normal” or “usual”. Whereas value who break those rules are recognized as being unusual.
What is a normal distribution?
A normal distribution is a very common probability distribution. In real life, the normal distribution approximates many natural phenomena.
A data set is known as “normally distributed” when most of the data aggregate around it's mean, in a symmetric way. Also, it's extreme values get less and less likely to appear.
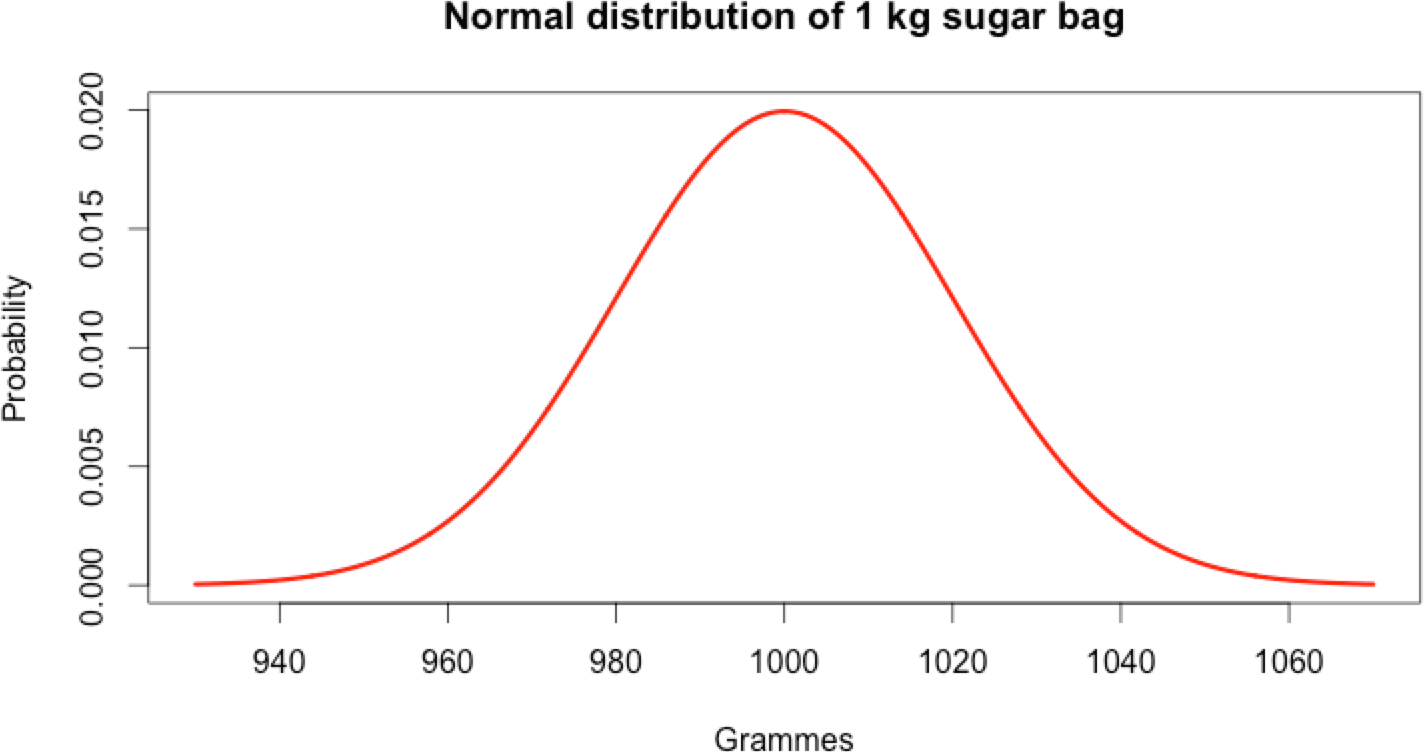
Example
When a factory is making 1 kg sugar bags it doesn’t always produce exactly 1 kg. In reality, it is around 1 kg. Most of the time very close to 1 kg and very rarely far from 1 kg.
Indeed, the production of 1 kg sugar bag follows a normal distribution.
Mathematical rules
When a metric appears to be normally distributed it follows some interesting law. As does the sugar bag example.
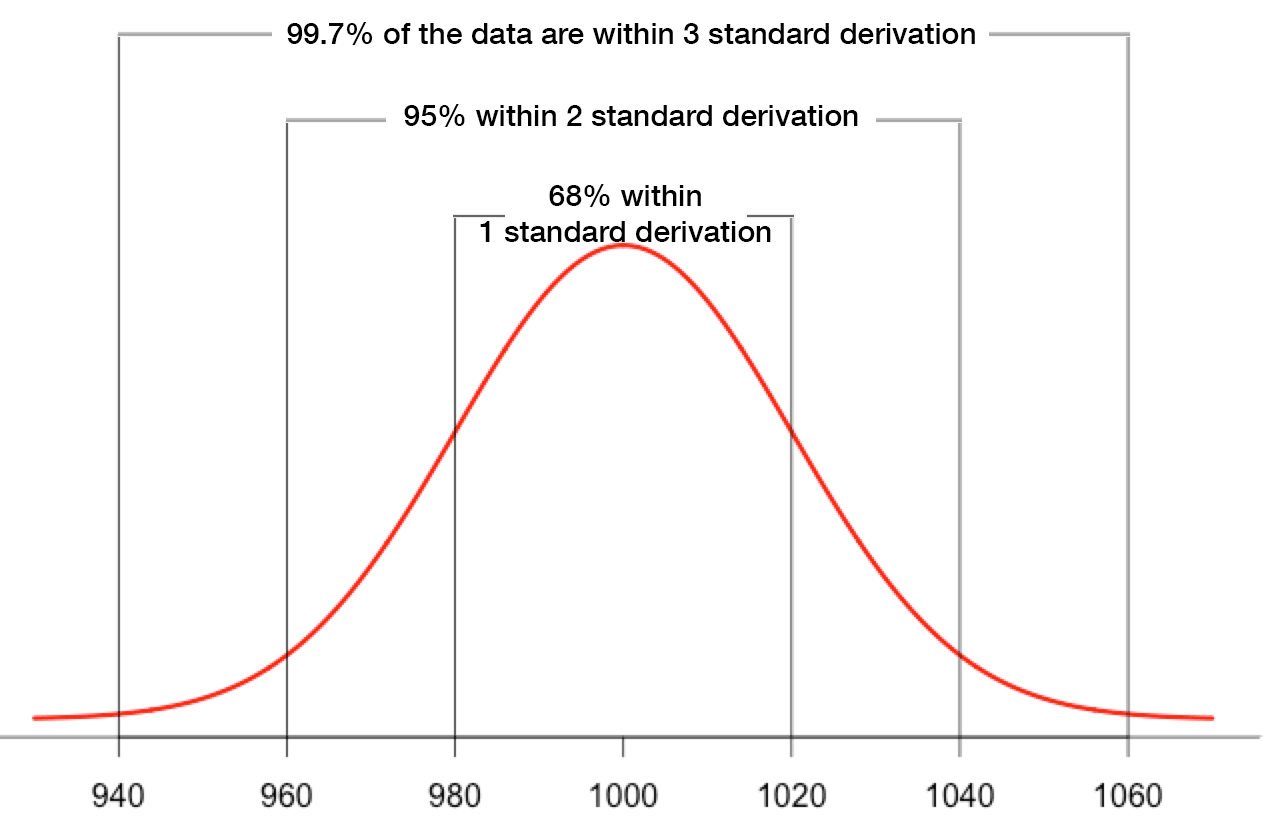
The mean and the median are the same. Both are equal to 1000. It’s because of the perfectly symmetric “bell-shape”
It is the standard deviation called sigma σ that defines how the normal distribution is spread around the mean. In this example σ = 20
68% of all values fall between [mean-σ; mean+σ]
For the sugar bag [980; 1020]
95% of all values fall between [mean-2*σ; mean+2*σ]
For the sugar bag [960; 1040]
99,7% of all values fall between [mean-3*σ; mean+3*σ]
For the sugar bag [940; 1060]
The last 3 rules are also known as the 68–95–99.7 rule also called the three-sigma rule of thumb
When the rules get broken: it’s an anomaly
As previously stated, When a system has been proven normally distributed, it follows a set of rules.
Those rules become the model representing the normal behavior of the metric. Under normal conditions, upcoming values will match the normal distribution and the model will be followed.
But what happens when the rules get broken?
This is when things turn different as something unusual is happening.
In theory, in a normal distribution, no values are impossible. If the weights of the bags of sugar were really distributed, we would probably find a bag of sugar of 860 g every billion products.
In reality, we approximate this sugar bag example as normally distributed. Also, almost impossible value are approximated as impossible
Techniques of Anomaly Detection
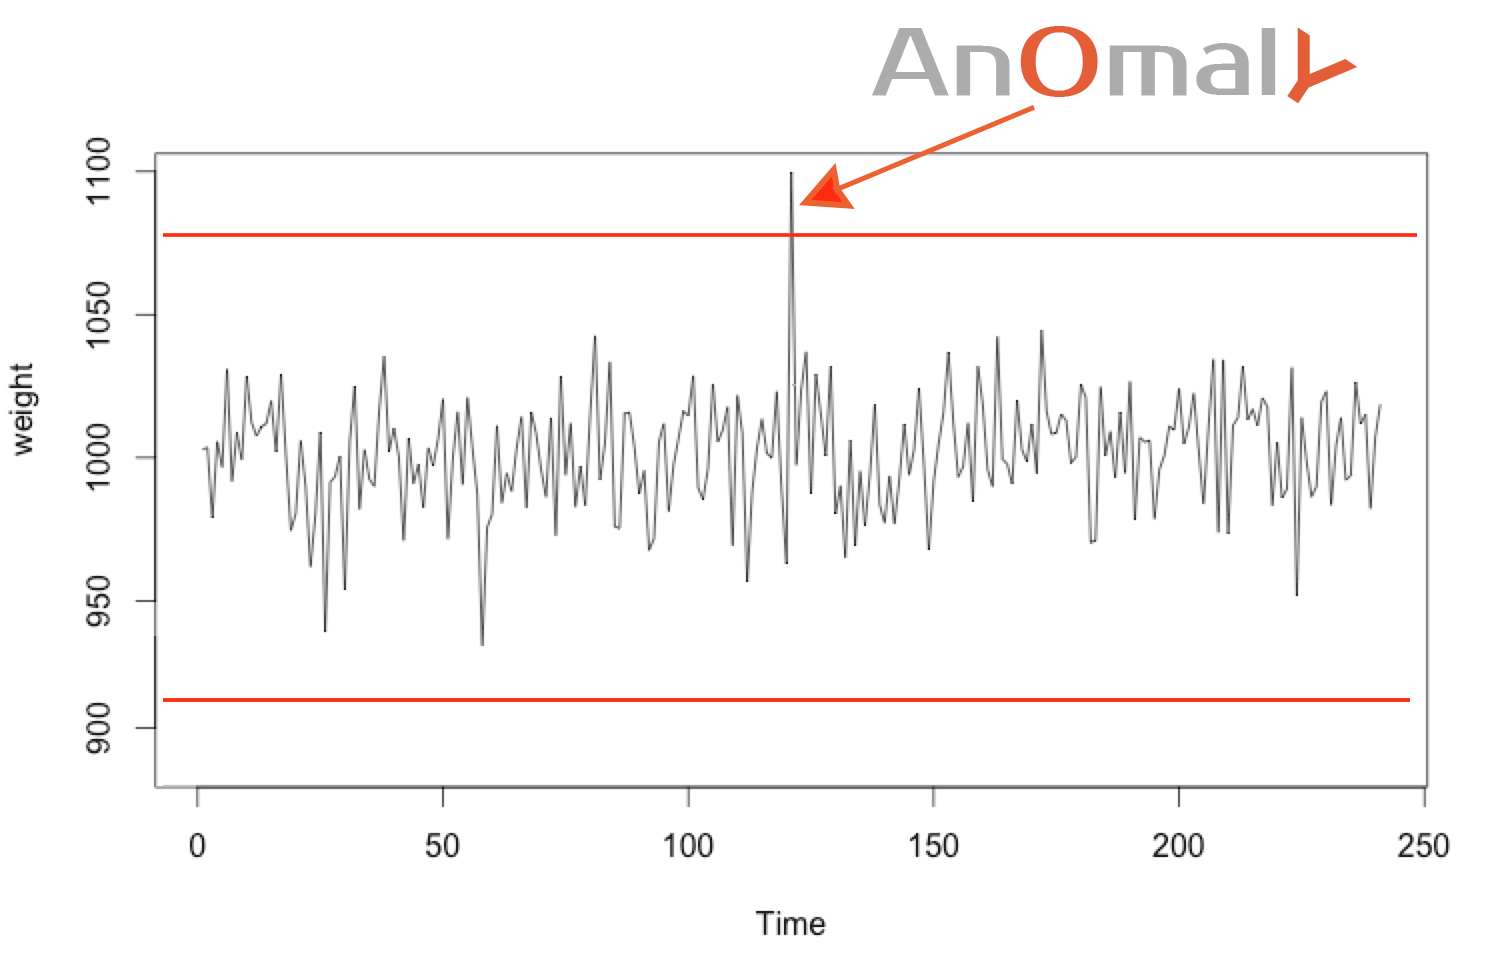
Technique n°1: outlier value
An almost impossible value could be considered as an anomaly.
When the value deviates too much from the mean, let’s say by ± 4σ, then we can consider this almost impossible value as an anomaly. (This limit can also be calculated using the percentile).
Sugar bags who weigh less than 920 g or more than 1080 g are considered anomalous. Chances are, there is a problem in the production chain.
This provides a simple way to define maximum and minimum thresholds.
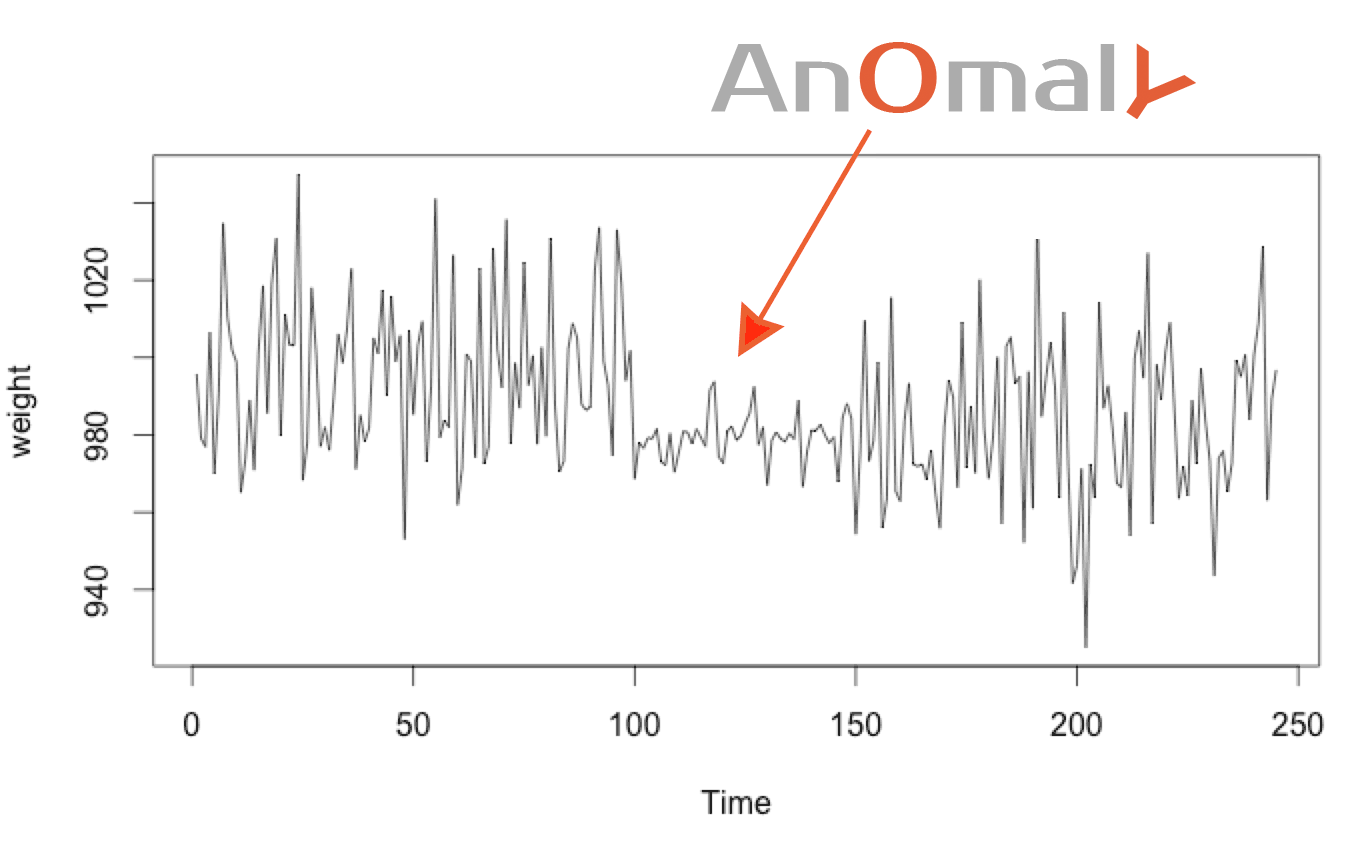
Technique 2: detecting change in the normal distribution
Technique n°2 can detect unusual distribution fast, using only some points. But it can’t detect anomalies who move from one sigma σ to another in a usual manner.
To detect this kind of anomaly we use a “window” of n last elements.
If the mean and standard derivation of this window change too much from usual then we can deduce an anomaly. Using a big window with a lot of values is more stable, but it requires more time to detect the anomaly.
The bigger the window is the more stable it becomes. But it would require more time to detect the anomaly as it needs to aggregate more values for the detection.