- Community
- IoT & Connectivity
- IoT & Connectivity Tips
- Configure ThingWorx Advisors for Trending and Aler...
- Subscribe to RSS Feed
- Mark as New
- Mark as Read
- Bookmark
- Subscribe
- Printer Friendly Page
- Notify Moderator
Configure ThingWorx Advisors for Trending and Alerts Part 1
Use ThingWorx Advisors to view trends and monitor Alerts.
GUIDE CONCEPT
The intent of this guide is to provide instructions to configure trends and alerts in the ThingWorx Advisors.
NOTE: This guide's content aligns with ThingWorx 9.3. The estimated time to complete all parts of this guide is 30 minutes.
YOU'LL LEARN HOW TO
In this guide, you will learn how to:
- Configure and view trends in machine performance
- Create and configure an alert
- Monitor an alert
Step 1: Configure and View Trends
To begin, you will learn how to open up ThingWorx Advisors.
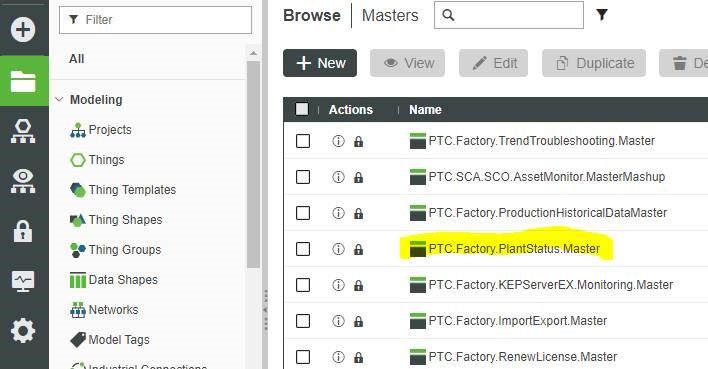
- In ThingWorx Foundation Composer, click Browse then Visualization > Master then click PTC.Factory.PlantStatus.Master.
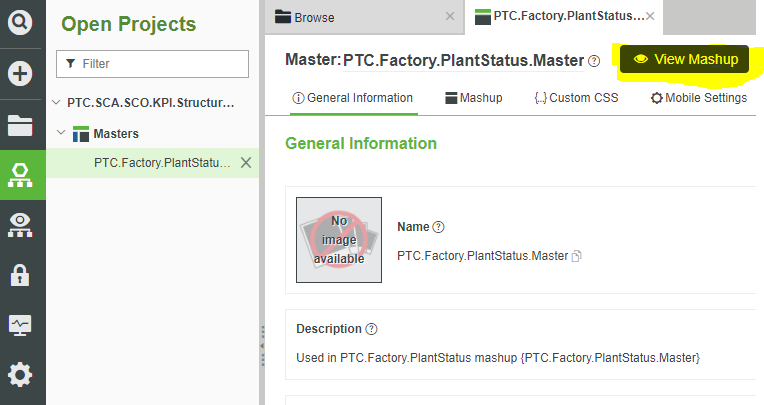
2. Next click the View Mashup button.
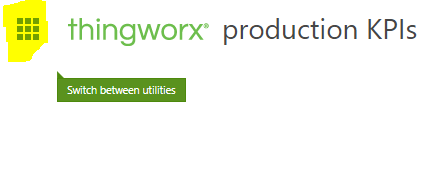
3. Click the Utility Selector grid in the upper left
4. Click Trending and Troubleshooting
5. Click the + icon.

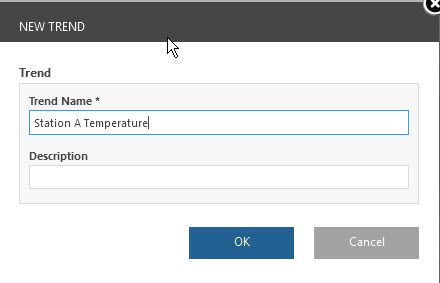
NOTE : A New Trend pop-up will appear.
6. In the Trend Name text box, type Station A Temperature, then click OK.
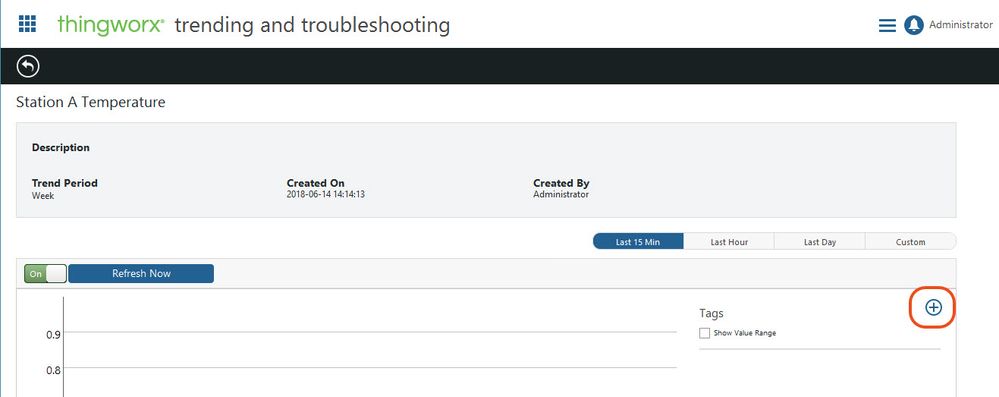
7. In the Tags area, click the + icon to start plotting a tag
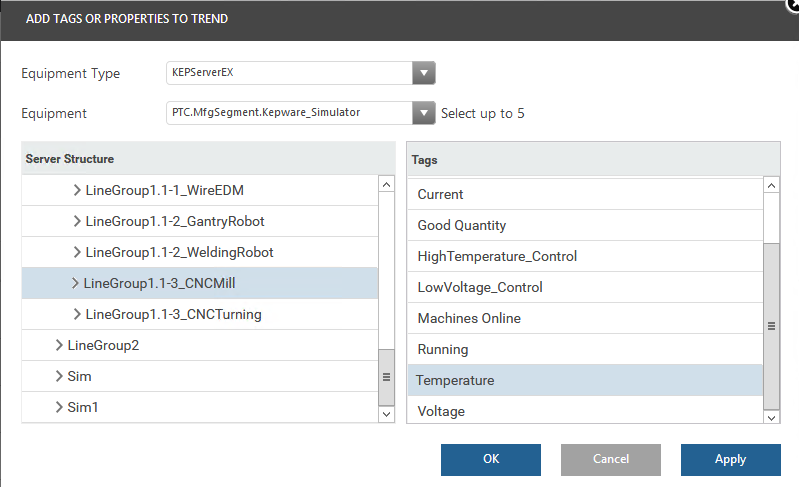
8. In the Equipment Type drop-down, choose KEPServerEX, in the Equipment drop-down,
choose your KEPServer or the simulation server.
9. In the Server Structure menu, click LineGroup1 and use the drop-down menu to select LineGroup1.1-3_CNCMill. In the Tags menu area, click Temperature then click OK, or choose a tag based on your KepServer configuration.
10. Review the trend data for Station A.
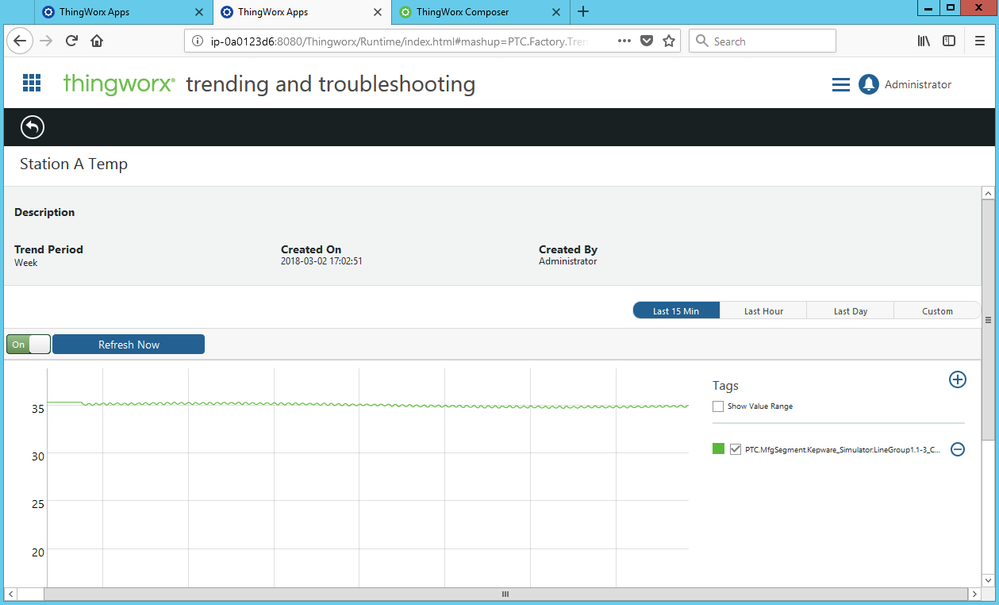
11. Repeat these steps to apply additional property setting to Station A.
12. Check the Show Value Range box in the Tags area. Review the trend data for the properties selected.
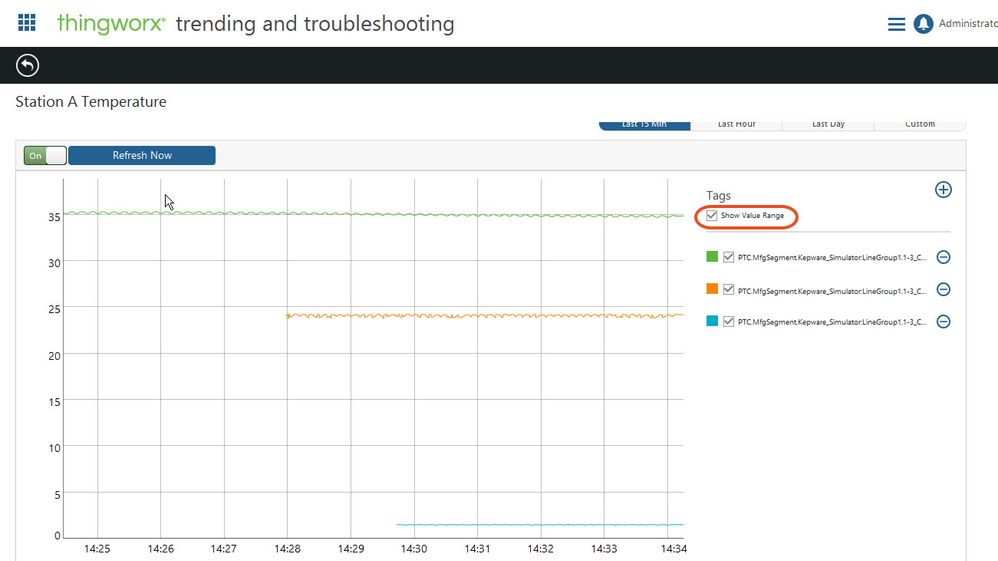
NOTE: The three selected tags will appear plotted in the Show Value Range table.
Click here to view Part 2 of the guide.

