- Community
- IoT & Connectivity
- IoT & Connectivity Tips
- Generating and Reviewing JMeter Results
- Subscribe to RSS Feed
- Mark as New
- Mark as Read
- Bookmark
- Subscribe
- Printer Friendly Page
- Notify Moderator
Generating and Reviewing JMeter Results
Generating and Reviewing JMeter Results
Overview
The 4th in a series of articles on load testing with JMeter, this one covers pushing the limits of a test to see how much the application can handle, as well as generating and analyzing reports once the testing completes. This article rounds off the basics of JMeter, such that anyone should be able to perform enterprise-level load testing after reviewing the content here.
Multiple criteria can be used to evaluate results, including:
- response time (as monitored both by JMeter, and by some other tool on the system side)
- throughput
- number of errors
- resource saturation
- CPU, Memory, disk, and network utilization
Depending on use case, some of these may be considered more important than others. For instance, some customers don't care if users wait a while for results to appear on the page (response time), because they set their users' expectations and mitigate the experience with well-designed loading graphics. With response times secondary, the real issues center around data loss or system outages, with resource utilization and number of errors becoming the more important indicators of system health. Request and database timeout errors are more important indicators, as they occur most often when resources are saturated and there is data loss.
It is typical for many customers to find preventing data loss and/or promoting data integrity to be more important than preventing long response times. Consider which of these factors is most important to your use case as you determine what kind of information to gather and review in your reports.
How to Create Client-Side Reports in JMeter
Creating reports for the client-side data is very simple using JMeter, both from the command line and within the UI (as shown in the tutorial below). These reports have graphical displays of response times, information about the number and type of response errors, and other criteria of performance used to gauge the success or failure of a load test. Follow these steps to generate an index file, which when opened in your browser of choice, will show all of the relevant JMeter data.
Tutorial:
- Create an empty directory in which to store reports:
- Start the JMeter test with these options, or run these commands after the fact, to generate the HTML report:
- Once the test completes, use:
jmeter -g <outputfile.jtl/csv> -o <path to output folder for html report> - To start a test with the correct command for report generation, use this command:
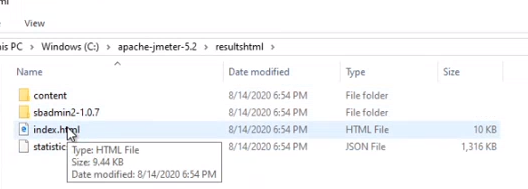
jmeter -n -t <test JMX file> -l <outputfile.jtl/csv> -e -o <Path to output folder> - Running the above commands will generate these files:
- Once the test completes, use:
- When the test is complete, the many JMeter client consoles will look like this:
- Go ahead and close the windows to terminate once they are finished. Optionally you can run multiple tests sequentially using the same jmeter-server windows.
- Click on the “index.html” file to open the results viewing window:
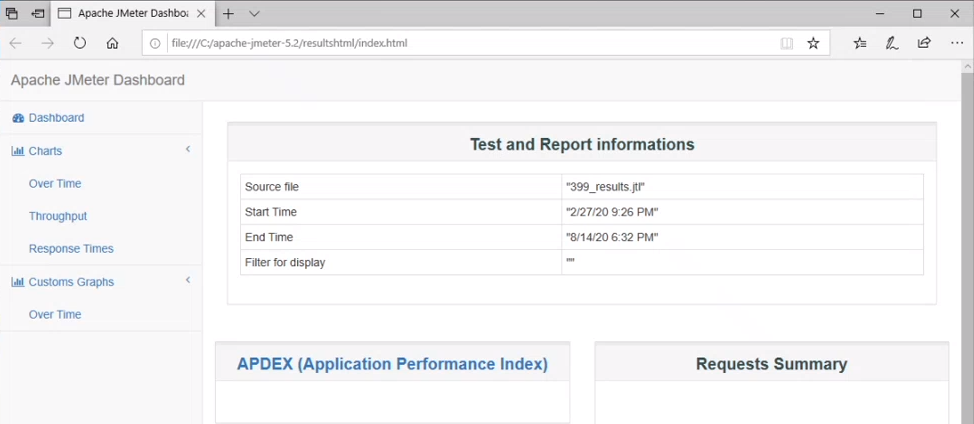
- At any time, modify the settings of this “HTML dashboard” using the details from the JMeter user manual. This citation describes many options for these dashboards, as well as recommendations on how to group and format the results in ways which best convey the success or failure of the test, based on the custom requirements of the application and how granular the view needs to be. Most of the time, the default settings work ok, showing something similar to this:
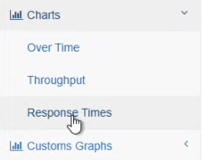
- The charts aren’t labeled very well here, so click on the Response Times submenu:
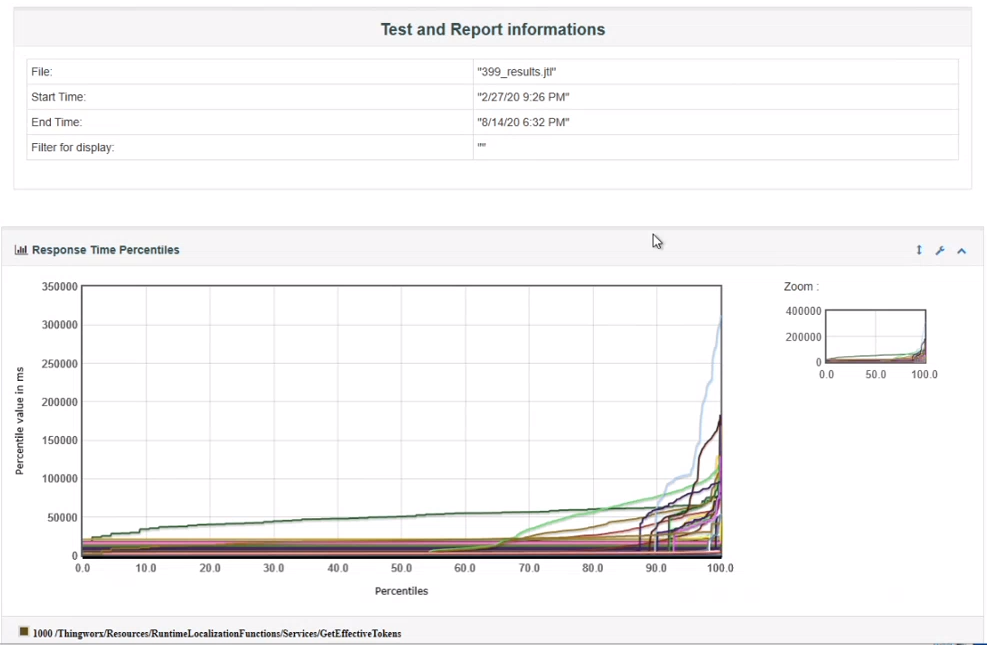
- This page may take some time to render if there is a lot of data:
- Next, scroll down to see all the requests that occurred and sort them by how long they took to complete. Anything which took over 5 seconds (or more depending on what is expected) should be investigated as part of the post-test analysis. Does something need to be tuned or optimized? This is how to tell which request is holding things up for your customers.
- There is also a chart that shows the overview, grouping the response times by how long they took to demonstrate the health of the system more concretely. Typically, the bars look something like this:
This represents expected behavior, where most of the requests are quite fast, and then there are a few that had errors or took a bit longer. This is pretty typical for web activity.
- The charts aren’t labeled very well here, so click on the Response Times submenu:
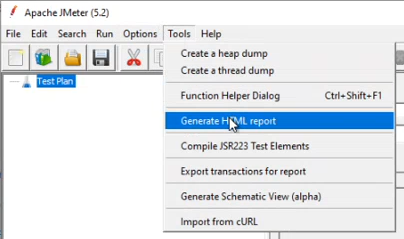
- You can also generate the report through the main JMeter client:
- Give it a results file and an output directory to generate the same index file:
- Give it a results file and an output directory to generate the same index file:
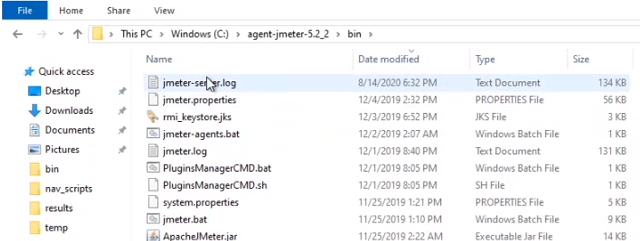
- There are log files in each of the JMeter client directories called “jmeter-server.log”:
- These files may show the wrong timezone, but the elapsed times are correct, and they will show when the JMeter clients started, how many threads they ran, which servers were which, and if there were any errors. Not all errors will mean a failed test, so review anything that appears and determine what is expected.
- Consider designing a batch script to gather all of these logs together, or even analyze them automatically to extract only relevant information.
- These files may show the wrong timezone, but the elapsed times are correct, and they will show when the JMeter clients started, how many threads they ran, which servers were which, and if there were any errors. Not all errors will mean a failed test, so review anything that appears and determine what is expected.
How to Create Server-Side Results in DynaTrace
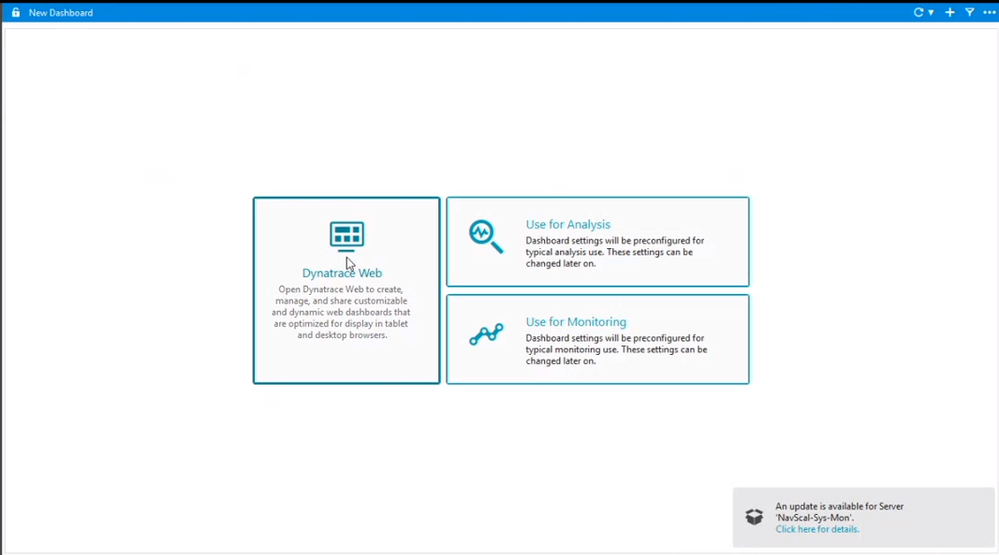
Collecting data from the environment, including CPU usage, Memory utilization (used vs. total), Garbage Collection times and other metrics of system health on the server, will require the use of an external tool. PTC’s official tool for this is called DynaTrace (PTC System Monitor), shown here. PTC offers a runtime license for DynaTrace to anyone who buys certain products, including Kepware Server, ThingWorx Foundation and Navigate, Windchill, Integrity, and more. Read more information about DevOps on the PTC Community, and stay tuned for more articles on the subject to come from the EDC.
Another option would be something like telegraf and Grafana (from the previous blog post), which facilitate the option to create dashboards around the data output specific to the needs of the application, which can still be monitored even once the application goes live. It can certainly be worth it to use such a tool for monitoring the server-side, but the set-up takes more time. Likewise, many VMs have monitoring faculties for CPU usage and memory utilization built-in, but DynaTrace also has visualization, consolidation of system elements, and other features that make it easy to use right out of the box. See the screenshots below for some examples on how to use DynaTrace, and be sure to review PTC’s full documentation here.
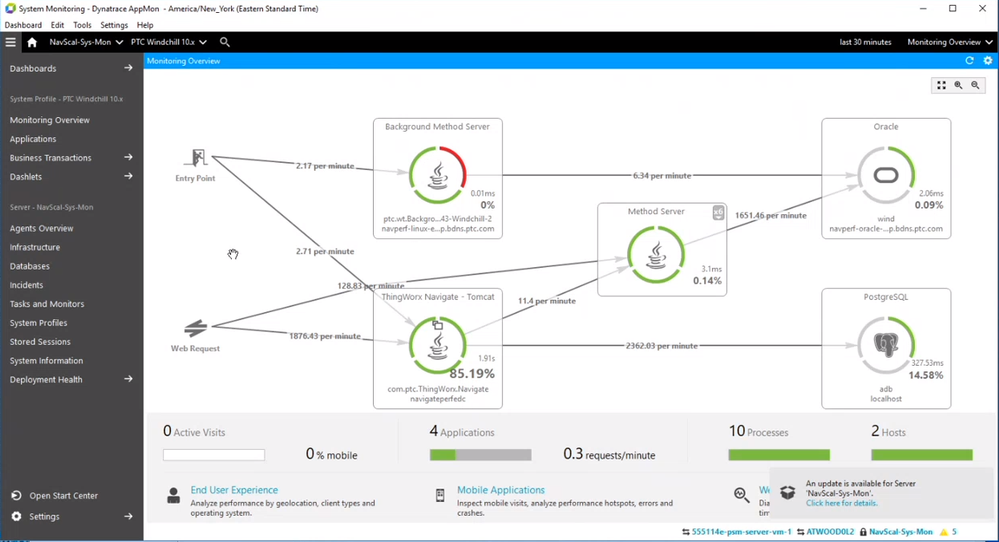
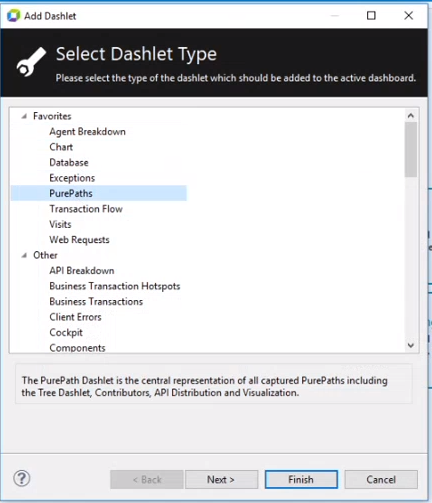
In DynaTrace, you can build new dashboards using PurePaths:
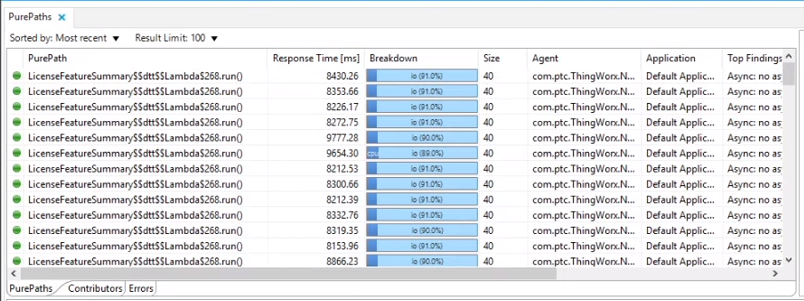
You can also look at the response times for each service, but be sure to change the response limit to a large number so that all the results are returned.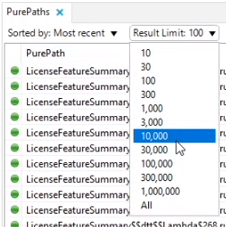
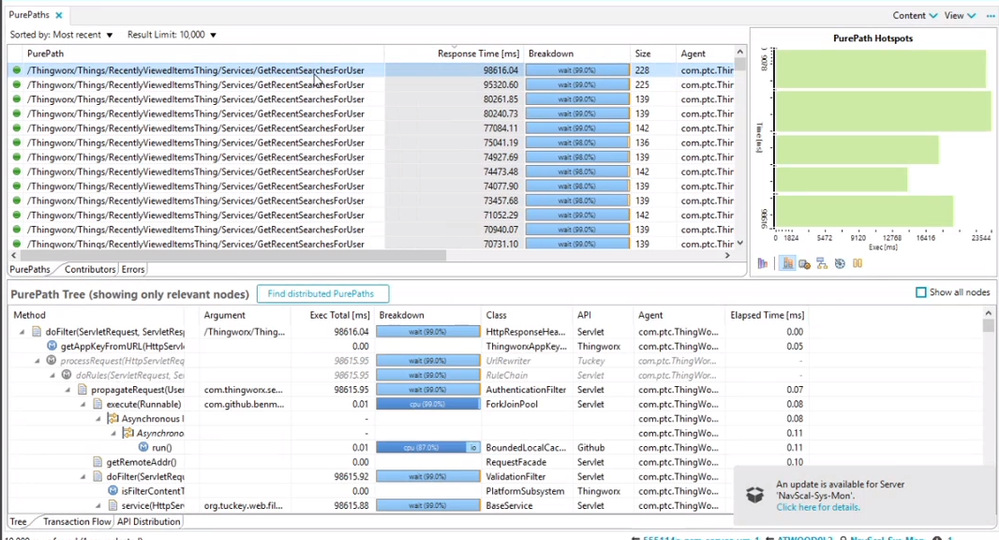
Highlighted here in DynaTrace is the longest service that ran, which in this case took 95 seconds to fully respond:
More specific analysis of this service can now begin. Perhaps it needs to be tuned, or otherwise optimized to handle the number of threads, i.e. the number of users. Perhaps the system needs more resources or the VM isn’t large enough for the test. Perhaps more JMeter clients and system resources are required. Something will explain this long response time, and that will inform as to what work might still remain before this system can scale up to the enterprise level.
How to Use the Test Results
Load Testing often means scaling the test up a little more each time until the system eventually breaks, or the target performance is reached. Within JMeter, this won’t mean increasing the overall number of threads per one JMeter client, but instead, scaling horizontally to other JMeter clients (as covered in the previous blog post). Now that the remote or distributed clients are configured and the test running, how do we know when the test is beginning to fail?
It turns out that this answer is not a simple one. Which results are considered desirable will vary from one customer to the next based on many factors, and analyzing the test results is a massive topic all on its own. However, there is one thing that any customer would care to review, and that is the response time overview chart found within the JMeter reports. This chart can be used to compare the performance of the majority of threads against a baseline, indicating the point at which the test begins to fail, i.e. the point at which the limits of the system are reached.
The easiest way to determine a good standard response time for a load test, a baseline, is to start with a single JMeter client and record the response times for just 1-5 threads. You can record the response times for individual requests, particularly queries and other services with expected long response times, or the average response times across all requests or groups of requests, if the performance of some mashups are more important than others.
This approach is better than relying on the response times seen in a browser because HTML pages load differently when rendered in a browser, with differing graphical resource requirements than what is requested in JMeter. Note that some customers will also manually record response times within a separate browser-based test scenario during load testing as either a sanity check or as part of their overall benchmarking in order to further validate the scalability of the application, but this wouldn’t involve JMeter given that browsers load things differently and cross-comparison is a bad idea.
Once the baseline response times are established, start increasing the thread counts across the many JMeter clients until you see the response times go up on average. PTC’s standard criteria for load testing is exceeded when the average response times are roughly doubled, or when the system seems overwhelmed with the user load on the server side (which is what to look out for in DynaTrace or the external system monitor). At this point, the application is said to have reached a bottleneck, which could be a simple tuning problem, or it could be saturated by resource requirements. Either way, the bottleneck is proof that the system can’t take any more threads without users beginning to notice and the response times approaching an unreasonable delay.
Other criteria can be used as well, say if any one thread takes more than 5 seconds to respond. Also ensure there are no unexpected errors, as gateway errors represent failed tests too. Sometimes there will be errors even when the test is successful, though, so consider monitoring the error percentage, a column in the Summary Report tab of JMeter, to see what is normal. The throughput column may also be something to monitor. Many watch for increases in throughput as the thread count increases to ensure there is no degradation in performance (which may indicate hardware or sizing constraints).
The Summary Report will look something like this, with thread group results from all of the clients appearing side by side, differentiated from each other by the unique port:
Conclusions
Generating and reviewing reports within JMeter is straight-forward and easily customizable. Be sure to also monitor the system itself using an external tool like DynaTrace, PTC’s official System Monitor, which has a lot of value considering how easy it is to use out of the box. If the system looks healthy on the server side and the response times are within an acceptable range on the client side, then the application is ready for enterprise use. Be sure to generate a baseline for response times within JMeter, remembering that browsers have different loading processes than JMeter, and not to cross-compare.
This article constitutes the end of the basics. The final article to come will talk about more advanced test design features and best practices, so stay tuned!


