
Turn on suggestions
Auto-suggest helps you quickly narrow down your search results by suggesting possible matches as you type.
Showing results for
Please log in to access translation
Turn on suggestions
Auto-suggest helps you quickly narrow down your search results by suggesting possible matches as you type.
Showing results for
- Community
- IoT & Connectivity
- IoT & Connectivity Tips
- JavaMelody, monitoring assistant for performance o...
Please log in to access translation
Options
- Subscribe to RSS Feed
- Mark as New
- Mark as Read
- Bookmark
- Subscribe
- Printer Friendly Page
- Notify Moderator
JavaMelody, monitoring assistant for performance of Java or Java EE application servers.
No ratings
Please log in to access translation
JavaMelody is an open source (LGPL) application that measures and calculates statistical information based on application usage. The resulting data can be viewed in a variety of formats including evolution charts, which track various operations and server attributes over time. There are also robust reporting options that allow data to be exported in either HTML of PDF formats.
Installation
Installation is fairly simple and can be done in just a few minutes. Download the distribution from JavaMelody Wiki and extract the javamelody.jar, available at https://github.com/javamelody/javamelody/releases
Step 1: Download the java melody file (in unix, use the following command*):
wget javamelody.googlecode.com/files/javamelody-1.49.0.zip
Note: Ensure the latest version available at the link provided above before executing the unix command, modify the version accordingly.
Step 2: Extract the zip file (using the following command in unix, note the version from step 1);
unzip javamelody-1.49.0.zip
Step 3: Copy the javamelody.jar and jrobin-x.jar from the javamelody installable to the WEB-INF/lib directory of the war file deployed in the tomcat using the following command in unix:
cp -pr javamelody-1.49.0 jrobin-x.jar /opt/tomcat/server/webapps/<application name>/WEB-INF/lib
Step 4: Edit the web.xml file from WEB-INF directory of the war file deployed in the tomcat and add the following lines in the web.xml before the description of the servlet.ie. mostly at the starting of the web.xml file.
<filter> <filter-name>monitoring</filter-name> <filter-class>net.bull.javamelody.MonitoringFilter</filter-class> </filter> <filter-mapping> <filter-name>monitoring</filter-name> <url-pattern>/*</url-pattern> </filter-mapping> <listener> <listener-class>net.bull.javamelody.SessionListener</listener-class> </listener>Step 5: Restart the tomcat server after editing the web.xml and access the javamelody page using the following url pattern:
http://<hostname on which tomcat is configured>:<Port number on which the application is accessed>/<application name>/monitoring
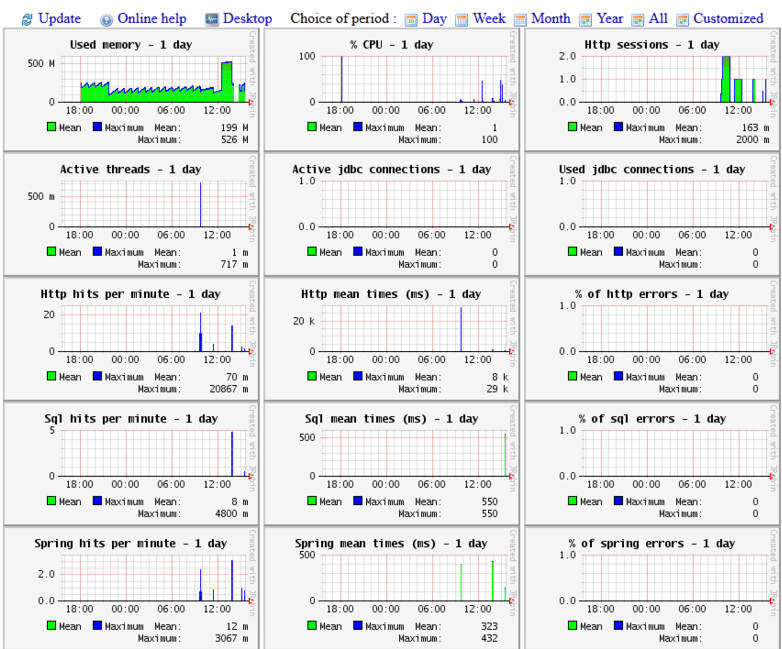
The url can be customized in the configuration file. Reports can be viewed in weekly, daily, or monthly formats. They can also be downloaded or can be sent over email in pdf format. iText library for WebApps and Java’s Mail and Activation libraries are required on the server in order to use the mail session. The report provides the same information that can be found in monitoring web page with both high-level and detailed information.
CPU&Memory usage:
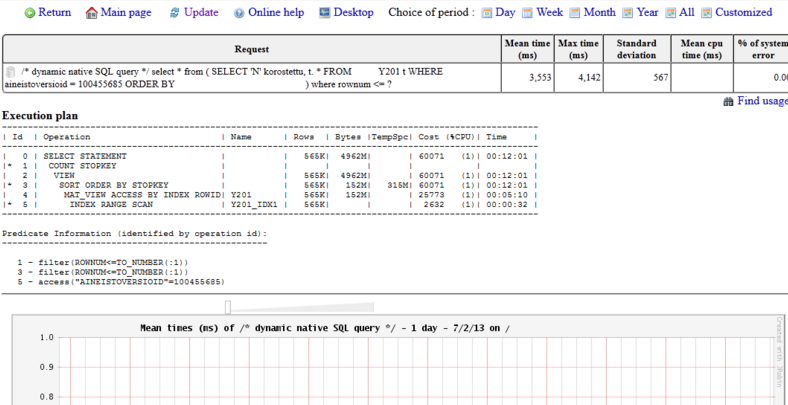
Detailed SQL Information:
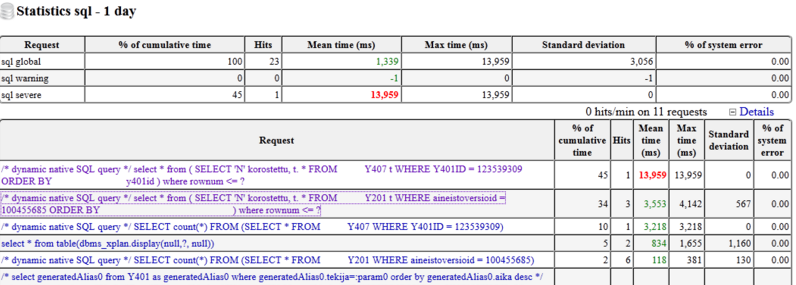
SQL Statistics:
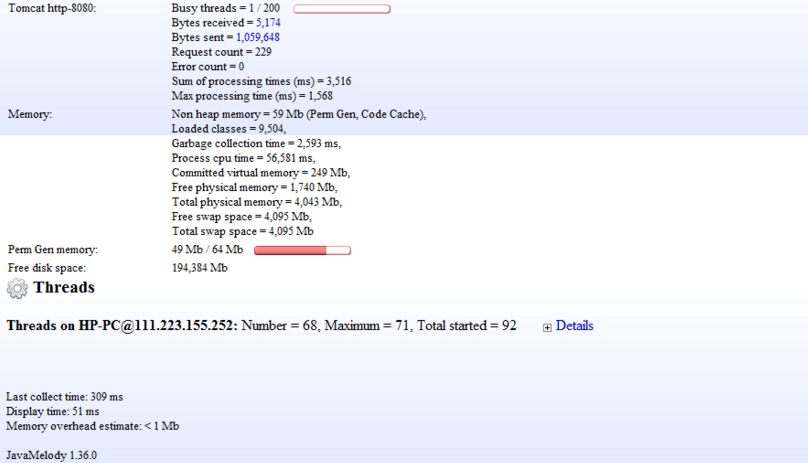
Server Requests:

System threads, caches:


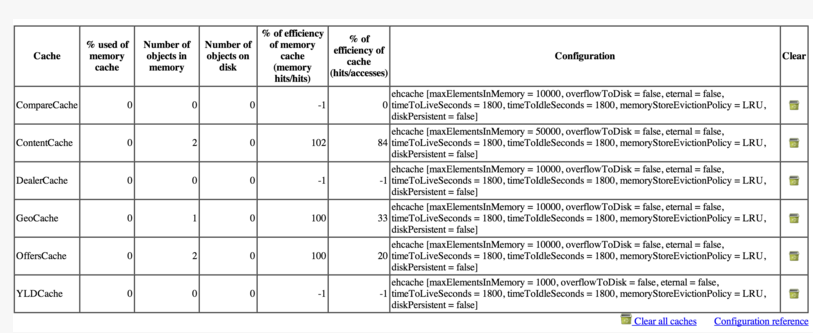
Data Caches:
System Overhead
On the JavaMelody Wiki, https://github.com/javamelody/javamelody/wiki/Overhead one can find a healthy discussion about system overhead. It seems that the general consensus is that the overhead cost caused by JavaMelody is very low and that the feature is safe to enable full-time in QA environment.
->JavaMelody records only statistics and not events, so the overhead of memory is quite minimal.
->No I/O on the wire and minimal I/O on disk.
If no problem arises, it can be considered to enable JavaMelody on the production environment as well.
Using a tool like JavaMelody can lead to valuable insights on how to optimize servers or uncover otherwise hidden issues, providing value that exceeds the overhead cost.
