ThingWorx Monitoring and Alerting: Using Prometheus and Grafana, Part 2
- December 23, 2022
- 0 replies
- 4268 views

ThingWorx Monitoring and Alerting, Part 2
Using Prometheus and Grafana
By Tori Firewind, IoT EDC
Building Dashboards
To add a panel which monitors some component of the ThingWorx application to a dashboard in Grafana, click to add a new panel. Under “Metrics” in the box at the bottom of the screen, select what ThingWorx metrics you wish to monitor (type “thingworx” in the search box to see them all). For example, select the Platform Subsystem memory in use:

Label filters aren’t necessary, though you may want to sort by instance if you are monitoring multiple ones with the same dashboard. You may also want to take some time to format the Y axis, which by default will show in bytes. Go to the formatting panel on the right side and scroll down to the section called “Standard options”. For the Unit dropdown, start typing “data” and then select “bytes (SI)”. This will automatically determine if the bytes you’ve provided should really print as MB or GB based on how large the numbers are.
Rename the panel, modify it in any other way desired, and then click Apply (last 5 minutes):
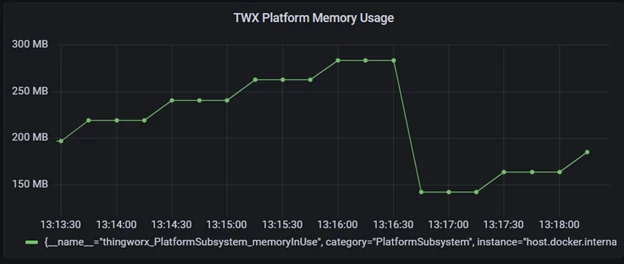
Once you add the panel, you can watch the memory usage as it is scraped by selecting the refresh option (10s or 30s, whatever makes sense based on your scrape interval).
The viewing window is stored in the URL, so that you can generate a report for a specific interval (like when a test was occurring), and then store that result or share it in a more compact way: http://localhost:3000/d/nleucPv4k/thingworx-monitoring?orgId=1&from=1668528038732&to=1668536503953 (absolute timestamps):
Dashboards are just collections of panels which report on all of the various metrics of performance and stability that exist for single components of a system. This is because there can be quite a few metrics worth watching for each individual component. Most of the third-party tools come with their own dashboards, but the ThingWorx component is one which for now, requires some thought and creativity.
Consider your use case carefully and look over the various subsystems contained within ThingWorx. Each part of an application is localized to specific subsystems, and some are more business critical than others. What will go at the top of your dashboard? Add rows, add panels per row, and see what the many choices are for watching your system.
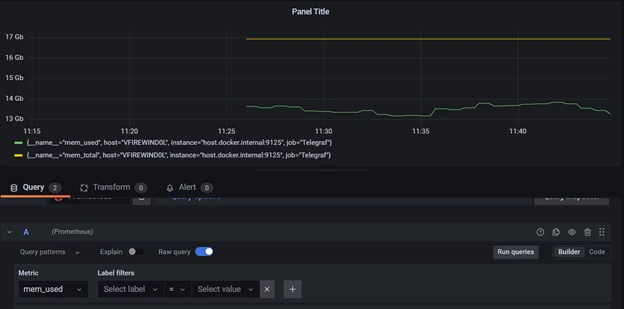
Don’t forget that with Telegraf running, VM or machine usage metrics are also available for display on a dashboard. Things like overall CPU and Memory usage are critical to determining the health of a system, as we have demonstrated in our own reasoning in past benchmarks and scale tests. You can create a panel to monitor the mem_used versus mem_total, like so:
Another metric from Telegraf worth adding is the CPU usage, which should be given “percentage” for the units and which needs a label filter of cpu = cpu-total. If we do some resizing and drag-and-dropping, then we now have the first row of a dashboard:

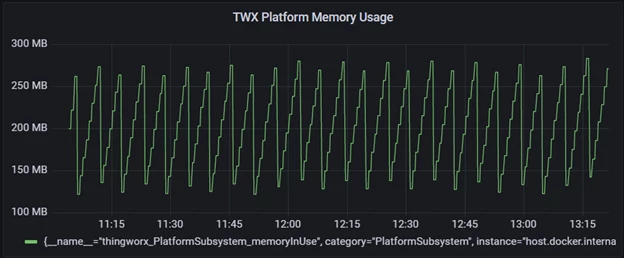
See how the Platform usage climbs steadily and is purged in a cycle? That is the Java Garbage Collection mechanism, and it’s important to remember to leave room for spikes on top of those peaks. Data can also be calculated or processed in some way to make it more useful for determining system health and stability.
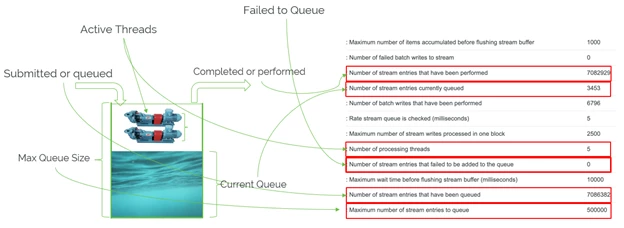
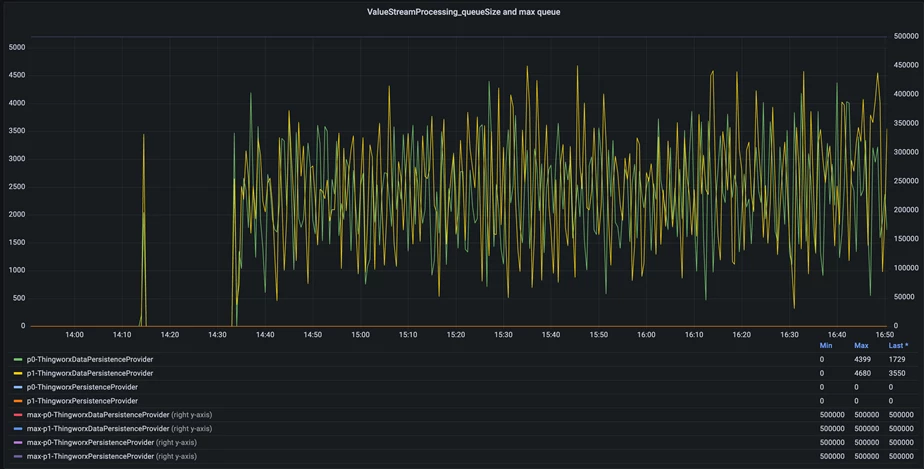
The data in the picture below uses the formula submitted = completed + number queued + number failed. It shows the current queue on the left Y-axis and the max queue on the right (since the two numbers usually are drastically different). It looks pretty, but it doesn’t really tell us much about the system in this format, so let’s do some math and find a representation that is a bit more helpful.
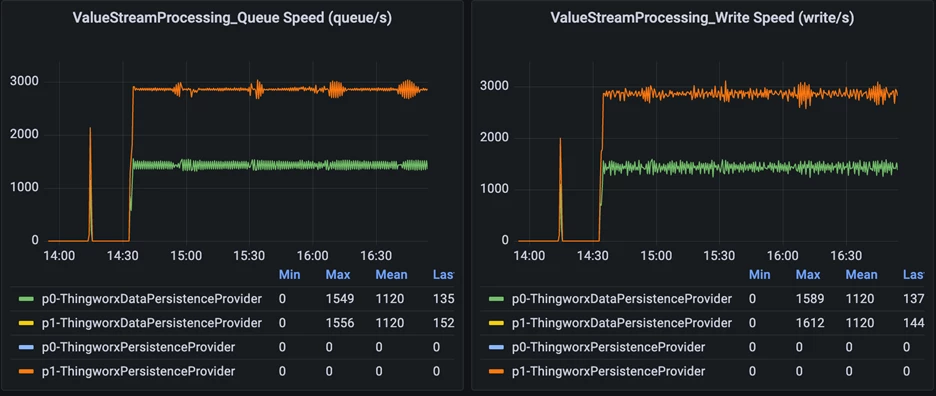
Performing a “non-negative derivative” calculation over the submitted and the completed queue counts over time allows for us to look at the status of the queue as a velocity. When the “complete” speed appears behind the “submitted” speed for too long at a time, then that means the queue is filling up and will eventually result in data loss.
If we take this one step further and calculate the average of the submitted minus the completed over time, then we can actually predict approximately when the queue will fill up. This can then be displayed on a dashboard in Grafana, or used as the basis for an alert.
What to Monitor

In addition to monitoring the system which ThingWorx runs upon, ThingWorx itself can easily be monitored down to the subsystems level by Prometheus due to the Metrics endpoint. Many applications have support built into the way they format the data for scraping, including the JVM (which exposes Prometheus-formatted metrics with the JMX Exporter) and the OS (which can use the Node Exporter or Telegraf for the same purpose). For these more generic components, there are popular community dashboards which can be downloaded and used in Grafana for data analysis and review.
For ThingWorx, there’s different kinds of data to track: subsystem data (see the list on the right) and non-subsystem data. There’s queue based versus non-queue data. These different metrics can collectively characterize the overall health of the application, depending on the use case.
For instance, if this is a system with very many connected devices, one metric which may be important to track is the number of total devices defined on the Foundation server vs. the number of devices which are currently connected. If there are relays involved, then many devices suddenly going offline can mean a relay has failed. Another example is if the system sizing depends on an assumption that there will only ever be a fraction of the total number of devices connected at a time. Use cases like these could be monitored easily by keeping track of the total vs. the number of connected devices.
Other common indicators of a healthy ThingWorx application might include the value stream and stream queues. These queues should fluctuate over time as the data is ingested and processed, but they should never be growing in size. If the stream queues are growing, then that means the data is writing to the queues faster than the queues can write to the database. Eventually, when the system runs out of resources to keep track of the queues, data will be lost. Having the stream information displayed in a chart can make it very easy to spot an upward trend in resource usage early on, which can catch a blockage or bottleneck that needs attention before it starts to affect the larger system in catastrophic ways later.
Memory usage information from the various subsystems might be something worth tracking, as well as the event queue. These can indicate that the business logic is functioning with room to handle spikes, and that the server has enough memory to service all three dimensions of an IoT application: the ingestion, the business logic and thing-based alerting, and the user experience and UI. If file transfers are a key part of the use case, then the number of concurrent transfers, the average speed of them, the size of the files, all of this kind of stuff can be tracked and charted in Grafana by making use of the ThingWorx metrics which automatically show up there once you import the Prometheus data source.
A mature dashboard used for a production environment might look a little like this:
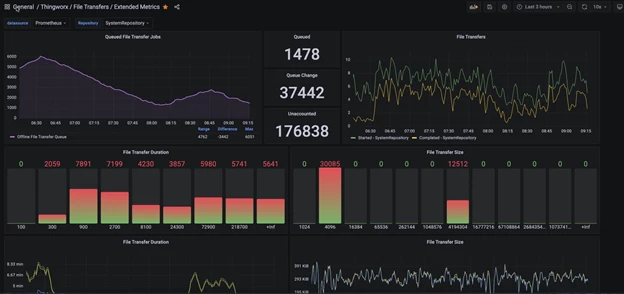
For further reading about subsystem monitoring, check out the Help Center.
How to Alert
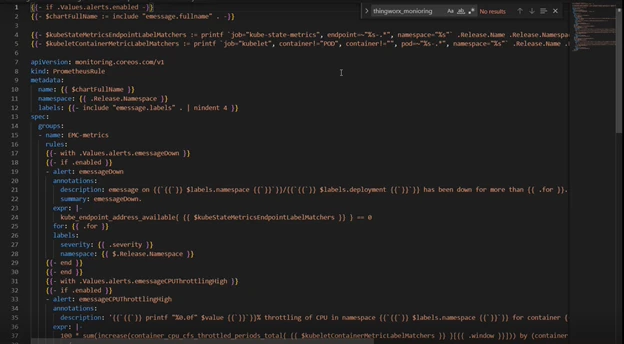
The alerting mechanism built-in to Prometheus is incredibly easy to configure, so it might be tempting to generate tons of alert rules. However, remember that the more noise a system makes, the harder it is for those monitoring that system to know when action is really required. Playbooks which document how to respond to alerts, who to contact, how to act, and all the information necessary to handle an alert, should be created as an ongoing part of the DevOps process.
Alerts should fire with the right severity in the subject line, as well as all of the information about the issue that is currently known, presented in a concise way, so that whoever receives the alert starts thinking about the root cause sooner and recovers the system faster. Those who receive the alert should have the ability to facilitate its resolution, and know who is expected to react to any alerts which come in.
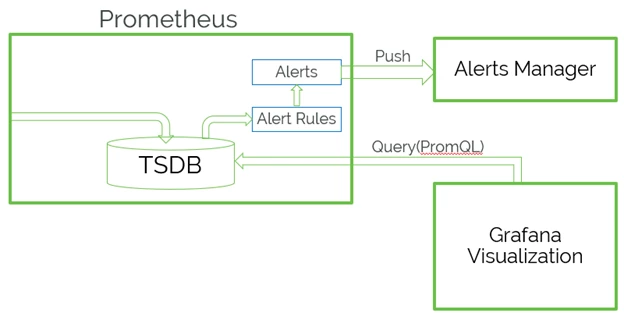
In the ThingWorx monitoring stack, Prometheus handles the alert rules and the generation of alerts, but alert filtering and delivery is managed in an external alerts manager.
Generally, you want your alerts to follow a curve. If the current queue size exceeds 50% of the maximum, perhaps that isn’t a huge deal, if the application catches up quickly. How long are spikes in queue processing expected to last? Perhaps if the queue size is over half-full for 10 seconds, 30 seconds, then that means the queue is falling behind and not catching up. Ok, so this might be a warning level alert. When does this become an error? Well, let’s say the queue exceeds 90% of the max queue size. This might want to alert the moment it hits the mark. Now, farther along the curve, it may not take as long before data gets lost.
As the severity of the situation increases, the threshold for alerting should increase as well. That way when errors do alert, it is a sure thing that they require a response immediately. The alerts are then pushed into the “Alerts Manager” for delivery based on your management rules. The Alerts Manager may decide to withhold warnings altogether, or send them to a much smaller mailing list, whatever filtering helps to ensure the right people receive the right alerts, right when they need them.

In Conclusion, A Healthy Application...
Has stable memory usage that fluctuates predictably and doesn’t grow over time. In a system experiencing mild issues, the memory starts to trend upward:
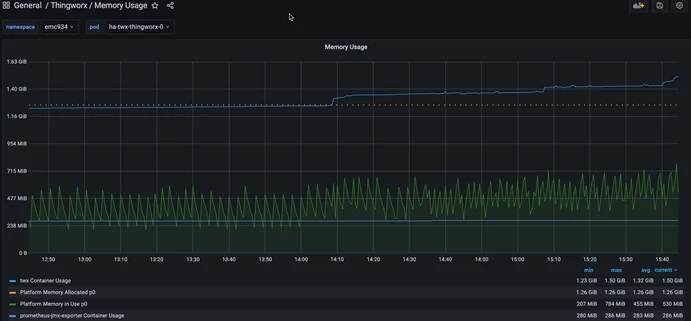
If left unattended, systems like this may eventually experience outages. Finding the issue this early means there is even time to do some digging, debugging, taking of stack traces, and other such troubleshooting steps before the system must be restarted or recovered. That can really make the difference in identifying and resolving before there are real problems.
One metric which makes for good alerting is the total number of failed stream entries, which can indicate there’s an issue writing to the database even before the queue has started to fill up. Other alerts may include warnings and errors based around percentages of memory used or queues filled, which depend on how long the queues take to fill up and how long the state has been at its increased usage.
Prometheus has all of the tools necessary to make this possible across a variety of infrastructures and use cases. Set it up on a local machine and poke around at what ThingWorx metrics are available to meet your monitoring needs.

