- Community
- IoT & Connectivity
- Mfg Solutions & Apps
- Customized chart widget
- Subscribe to RSS Feed
- Mark Topic as New
- Mark Topic as Read
- Float this Topic for Current User
- Bookmark
- Subscribe
- Mute
- Printer Friendly Page
Customized chart widget
- Mark as New
- Bookmark
- Subscribe
- Mute
- Subscribe to RSS Feed
- Permalink
- Notify Moderator
Customized chart widget
Hi,
I have imported the customized chart widget.Is there any documentation available on how to use customiazed chart widget?
Please provide some help on how to configure bindings and use custom chart widget.
Thanks,
V.Shalini.
Solved! Go to Solution.
- Labels:
-
Best Practices
-
Design
-
Mashup-Widget
Accepted Solutions
- Mark as New
- Bookmark
- Subscribe
- Mute
- Subscribe to RSS Feed
- Permalink
- Notify Moderator
Shalini,
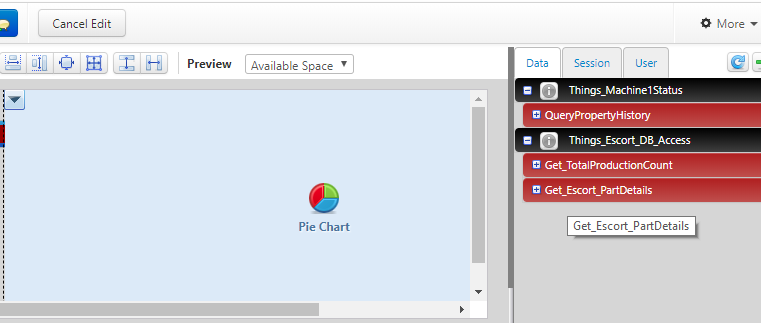
In case of charts, you have to return as Info Table with Data Shape you want. Depending on type of graph/chart, info table could be single row or several rows. In case of pie chart it will be single row. The Data Shape will define the fields/columns in the info table. There are some configurations available as part of widget. You will see them after binding with your data. You will find some good samples in developer community and you may want to search it there.
Thanks,
Varathan
- Mark as New
- Bookmark
- Subscribe
- Mute
- Subscribe to RSS Feed
- Permalink
- Notify Moderator
Shalini,
We are working on it. Let me know which one you are looking at it. I can try to get that sooner.
Thanks,
Varathan
- Mark as New
- Bookmark
- Subscribe
- Mute
- Subscribe to RSS Feed
- Permalink
- Notify Moderator
Greetings Shalini (shalini visveswaraiya),
Following up with you on your original question posted here, were you able to work out the details with Varathan, (particularly, his question about which Custom Chart Widget you are interested in using)?
Or, if you are still unresolved on your original question, let us know and we can continue troubleshooting this with you. This feedback is a key step toward ensuring Community users with a similar issue are able to locate the information they need.
Best regards,
Steven M
- Mark as New
- Bookmark
- Subscribe
- Mute
- Subscribe to RSS Feed
- Permalink
- Notify Moderator
Hi Steven,
I have not resolved yet.
Thanks for your response.
I am looking for bar chart mainly.
I am not able to provide data field for single source.
At first place,It doesnt display any data when I bind it as single datasource.
Also I wanted to know is it possible to show it in bar graph for a single value? (eg: I have a value 'Availability=0.969' I wanted to show that 0.969 alone in a graph for data field value which am not able to do.)
Please provide some possible solution.
Any suggestion will be appreciated.
2)Also is it possible to bind two sources from two different service to pie chart?
Thanks,
V.Shalini.
- Mark as New
- Bookmark
- Subscribe
- Mute
- Subscribe to RSS Feed
- Permalink
- Notify Moderator
Hi Varathan,
Thanks for your response.
I am looking for bar chart mainly.
I am not able to provide data field for single source.
At first place,It doesnt display any data when I bind it as single datasource.
Also I wanted to know is it possible to show it in bar graph for a single value? (eg: I have a value 'Availability=0.969' I wanted to show that 0.969 alone in a graph for data field value which am not able to do.)
Please provide some possible solution.
Any suggestion will be appreciated.
Thanks,
V.Shalini
- Mark as New
- Bookmark
- Subscribe
- Mute
- Subscribe to RSS Feed
- Permalink
- Notify Moderator
Shalini,
Not everything is widget. Some of them are container mashups. Unless you provide the mashup name your are looking at it or the screen shot, it will be difficult to help. I would appreciate if you could provide the above information. Based on the description, I suspect it could be Container Mashup.
Thanks,
Varathan
- Mark as New
- Bookmark
- Subscribe
- Mute
- Subscribe to RSS Feed
- Permalink
- Notify Moderator
Hi Varathan,

in this case, I wanted to bind the data of two services totalproductioncount and partdetails. But pie chat allows single data source.
This is one place where I am stuck with this chart.
Please Provide some guidance.
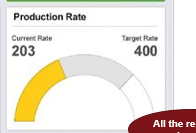
And also I wanted to know this chart is possible? Its the combination of three data values (oee,availability,performance). How can I achieve it?
Can I get this exactly as in the image?

Thanks,
V.Shalini.
- Mark as New
- Bookmark
- Subscribe
- Mute
- Subscribe to RSS Feed
- Permalink
- Notify Moderator
Shalini,
In case of charts, you have to return as Info Table with Data Shape you want. Depending on type of graph/chart, info table could be single row or several rows. In case of pie chart it will be single row. The Data Shape will define the fields/columns in the info table. There are some configurations available as part of widget. You will see them after binding with your data. You will find some good samples in developer community and you may want to search it there.
Thanks,
Varathan
- Mark as New
- Bookmark
- Subscribe
- Mute
- Subscribe to RSS Feed
- Permalink
- Notify Moderator
Greetings @svisveswaraiya,
Following up with you on the original question posted here, if any of the responses answered this, please mark "Accept as Solution" for the benefit of others who may have the same question.
Or, if you are still unresolved on this issue, let us know and we can continue troubleshooting this with you.
Best regards,
Steven M
- Mark as New
- Bookmark
- Subscribe
- Mute
- Subscribe to RSS Feed
- Permalink
- Notify Moderator
Shalini,
We don't have any documentation at this point on this. However, we are working on releasing one for next release which is end of February.
If you can be more specific with your question with some screen shot it will be great. I can find the answer for you.
Thanks for patience.
Varathan
- Mark as New
- Bookmark
- Subscribe
- Mute
- Subscribe to RSS Feed
- Permalink
- Notify Moderator
Shalini,
Can you provide the screen shot? I am not sure which one you are talking about. Some of them part of Container Mashups with additional logics. The screen shot will help us to determine which one you are looking.


