Community Tip - When posting, your subject should be specific and summarize your question. Here are some additional tips on asking a great question. X
- Community
- Systems/Software Engineering
- Systems/Software Engineering
- Re: How to Create Project Dashboards
- Subscribe to RSS Feed
- Mark Topic as New
- Mark Topic as Read
- Float this Topic for Current User
- Bookmark
- Subscribe
- Mute
- Printer Friendly Page
How to Create Project Dashboards
- Mark as New
- Bookmark
- Subscribe
- Mute
- Subscribe to RSS Feed
- Permalink
- Notify Moderator
How to Create Project Dashboards
I have been using IBM, PREP, E3, SBM etc.. all these yrs and now since 2weeks i started using Integrity is found not that user friendly to fetch the information at one view as a Project MAnager (dashboard templates not found)
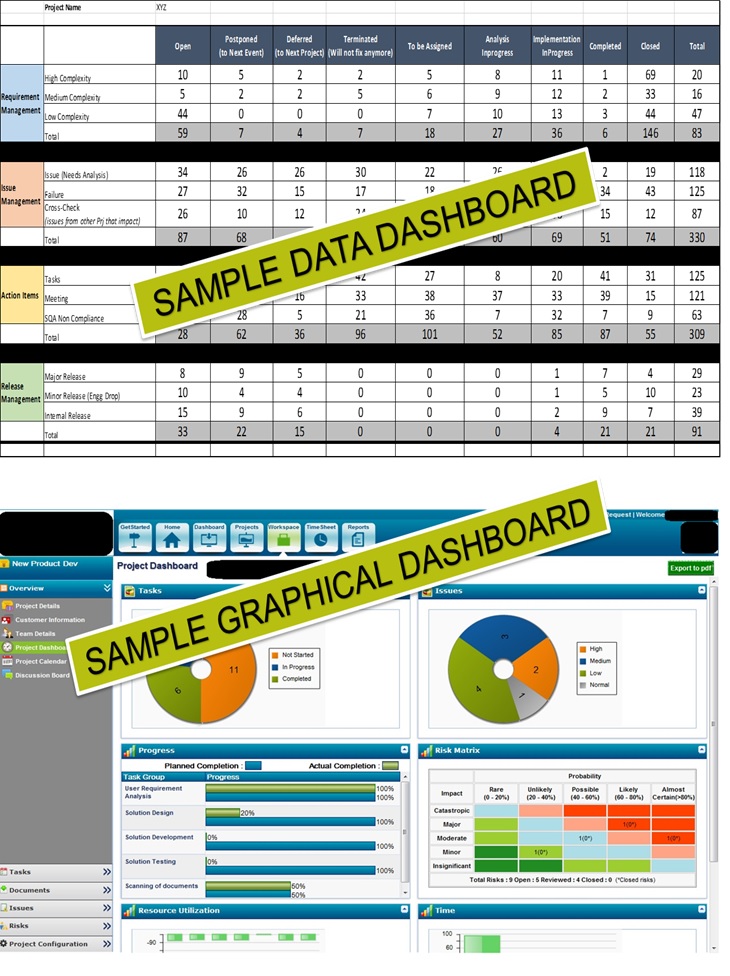
(PS: I am providing this dashboard as an example of how i want my project dashboard to look like which can be customized further by Admin/Project Owner)
I want to learn on can we create such/similar dashboard for projects that we handle using PLM Integirty ?
Any such material would be of great help as my project at new org is using Integrity only for requirements
but i understand Integrity can be used as one universal tool for everything but i have least to no experienced peers to bring PLM as one tool across my current org
Solved! Go to Solution.
Accepted Solutions
- Mark as New
- Bookmark
- Subscribe
- Mute
- Subscribe to RSS Feed
- Permalink
- Notify Moderator
Hello Balaji Muniraju,
The first image (Sample Data Dashboard) looks like it could be generated by one or more reports, one or more charts in a table format, or some combination of the two.
The second image (Sample Graphical Dashboard) looks like it could be generated by a group of charts.
Details on building dashboards are contained in the Integrity User Guide. For instance, in the Integrity 10.9 User Guide, they are described starting on page 511. To make full use of this, you'll need to read up on Charts and Reports as well.
Sorry for the reference directly to documentation--the scope of your question is too large to answer any other way.
I hope that helps.
Regards,
Kael
Kind Regards,
Kael Lizak
Senior Technical Support Engineer
PTC Integrity Lifecycle Manager
- Mark as New
- Bookmark
- Subscribe
- Mute
- Subscribe to RSS Feed
- Permalink
- Notify Moderator
No single response in 5days, requested to viewers to reply if this feature does exists or not with Integrity ?
- Mark as New
- Bookmark
- Subscribe
- Mute
- Subscribe to RSS Feed
- Permalink
- Notify Moderator
Hello Balaji Muniraju,
Your image link is broken, and looks like it points to a gmail mailbox. Could re-post the image from some other source?
Thanks,
Kael
Kind Regards,
Kael Lizak
Senior Technical Support Engineer
PTC Integrity Lifecycle Manager
- Mark as New
- Bookmark
- Subscribe
- Mute
- Subscribe to RSS Feed
- Permalink
- Notify Moderator
Hi, Please find the snapshot, let me know if this helps

- Mark as New
- Bookmark
- Subscribe
- Mute
- Subscribe to RSS Feed
- Permalink
- Notify Moderator
Hello Balaji Muniraju,
The first image (Sample Data Dashboard) looks like it could be generated by one or more reports, one or more charts in a table format, or some combination of the two.
The second image (Sample Graphical Dashboard) looks like it could be generated by a group of charts.
Details on building dashboards are contained in the Integrity User Guide. For instance, in the Integrity 10.9 User Guide, they are described starting on page 511. To make full use of this, you'll need to read up on Charts and Reports as well.
Sorry for the reference directly to documentation--the scope of your question is too large to answer any other way.
I hope that helps.
Regards,
Kael
Kind Regards,
Kael Lizak
Senior Technical Support Engineer
PTC Integrity Lifecycle Manager
- Mark as New
- Bookmark
- Subscribe
- Mute
- Subscribe to RSS Feed
- Permalink
- Notify Moderator
Kael,
Thanks for directing me towards the first step, do you have any sample dashboard scripts that are in-use so i can modify per my requiirement
- Mark as New
- Bookmark
- Subscribe
- Mute
- Subscribe to RSS Feed
- Permalink
- Notify Moderator
Hello Balaji Muniraju,
There are no out-of-the-box dashboards, so I can't supply you with a sample. If you create a new dashboard, though, in the Create Dashboard dialog you give it a name, select projects to filter on, and click on the Edit Layout... button in the top right corner of the dialog.
In the Edit Dashboard Layout, click on the Grid icon, then click on the canvas, and select how many rows and columns you would like on your dashboard. You can then add items from the pane on the left, enter text by clicking on the Text button on the toolbar, add images by clicking on the Image icon, etc...
At the bottom of that dialog, you can click on the Preview tab instead of the Layout tab. When you're done, click on the Close button on the bottom right.
Regards,
Kael
Kind Regards,
Kael Lizak
Senior Technical Support Engineer
PTC Integrity Lifecycle Manager


