Community Tip - Did you know you can set a signature that will be added to all your posts? Set it here! X
- Community
- PLM
- Windchill Discussions
- Re: How to Generate Charts In Cognos as per Date ...
- Subscribe to RSS Feed
- Mark Topic as New
- Mark Topic as Read
- Float this Topic for Current User
- Bookmark
- Subscribe
- Mute
- Printer Friendly Page
How to Generate Charts In Cognos as per Date Wise
- Mark as New
- Bookmark
- Subscribe
- Mute
- Subscribe to RSS Feed
- Permalink
- Notify Moderator
How to Generate Charts In Cognos as per Date Wise
Hi All,
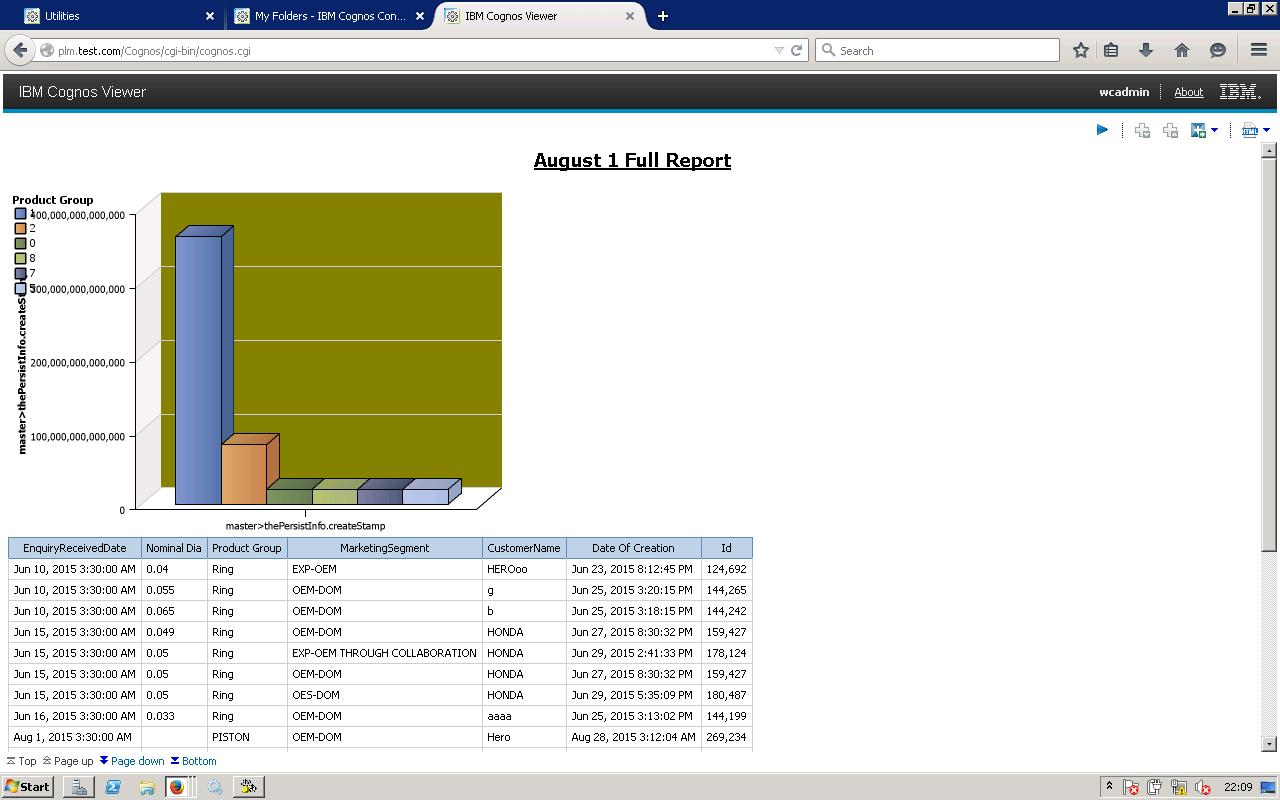
I'm using Cognos for generating reports. I've gnerated a report just like below..

In the above chart, on X-axis there is an attribute called master.thePersistInfo.createStamp which represents the date of creation(as in above report list) picked from Windchill querybuilder. and ProdutGroup on PrimaryAxis .
But, there I need a chart such that it represents date wise(i.e Date Of Ceation from the report list in above picture) product groups. i.e on x-axis different dates have to come and also primary axis should represents ProductGroup( Like Rings, Pistons.... in above picture) list with different colours.
I'm unable to generate this chartas I'm using Cognos for the first time.
I need your help to to do so.
Kindly request to help me out.
Thanks And Regards
krishna Chaithanya
- Labels:
-
Other
- Mark as New
- Bookmark
- Subscribe
- Mute
- Subscribe to RSS Feed
- Permalink
- Notify Moderator
Hi All,
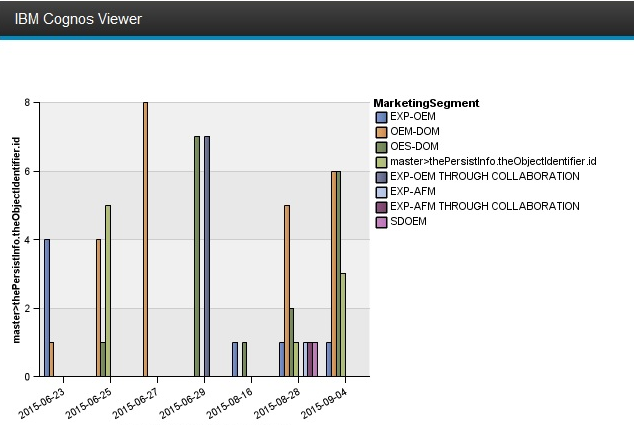
After investigating, I've got date wise report by giving below expression for Date..
_add_days(2015-09-02,_days_between([wt.inf.library.WTLibrary=Enquiry].[MarketSegment vs DateOf Creation for August Month].[master>thePersistInfo.createStamp],2015-09-02)).
And got chart like below..

But, I need to display month wise Marketing segment with corresponding months and quarter wise Marketing segments with three months as a group with string names like quarter1... When I'm trying to give _add_month expression getting validatin errors.
Kindly request to help me to achieve this as this is my high priority task.
Thanks in advance
Regards,
Krishna Chaithanya
- Mark as New
- Bookmark
- Subscribe
- Mute
- Subscribe to RSS Feed
- Permalink
- Notify Moderator
Hi,
I think you post may get better audience if posted in the Reporting section rather than Windchill.
Best regards


