

Non-linear material properties in Creo Simulate?
Hello,
I have been using Creo Simulate 2.0 for a few months for linear static structural analysis of plastic parts.
Now I want to move on to non-linear analysis.
I am facing difficulties in understanding how Creo Simulate sets the non-linear material properties.
The plastic I am using is brittle in nature.
Following are the engineering values available from the vendor's material data sheet:
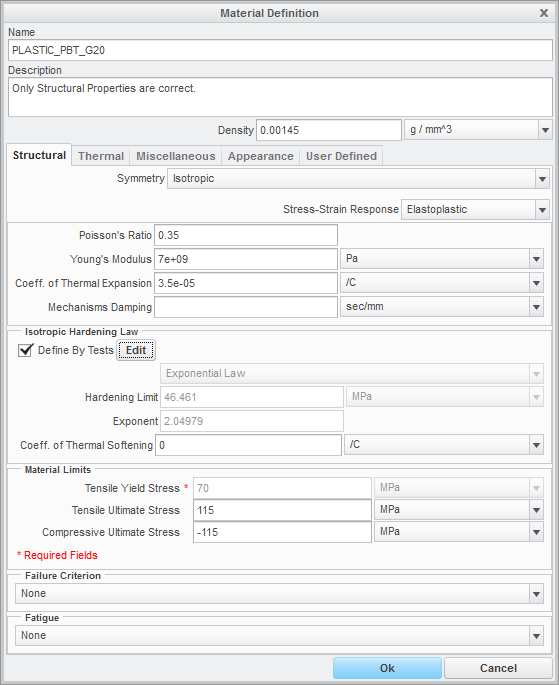
Young's Modulus = 7GPa
Stress at break = 115MPa
Strain at break = 2.6%
Flexural strength = 176MPa (Where do I put this value?)
Yield Strength is not available. So assuming = 70MPa
Here is what I put in Creo Simulate:
I have some questions:
1. Whatever I have done, is that right?
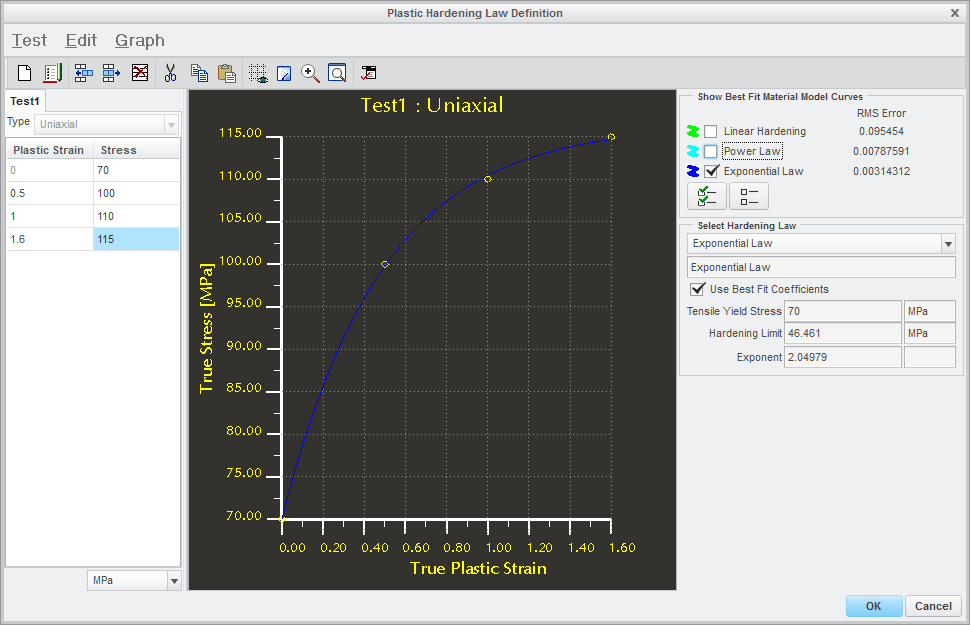
2. How do I see the entire stress strain curve for the material?
3. Does Simulate maintain tangency between the linear and non-linear curves?
4. Is there any significant difference in computation time between the 3 types of curves?
5. Does Simulate use the Yield Strength value for any type of simulation? In the sense that if I take the Yield strength value much lower than it is but maintain the same stress-strain curve, will it affect the results anyhow?
This thread is inactive and closed by the PTC Community Management Team. If you would like to provide a reply and re-open this thread, please notify the moderator and reference the thread. You may also use "Start a topic" button to ask a new question. Please be sure to include what version of the PTC product you are using so another community member knowledgeable about your version may be able to assist.